How to create a split bar chart
- Free
- Pro
- Business
- Enterprise
Split Bars work well when you have related numbers for a range of categories. You could do one chart per category, but that would make it more difficult to compare. The split bar chart it great to show comparison side-by-side. Here we show you how to create and customize such a chart with Datawrapper.
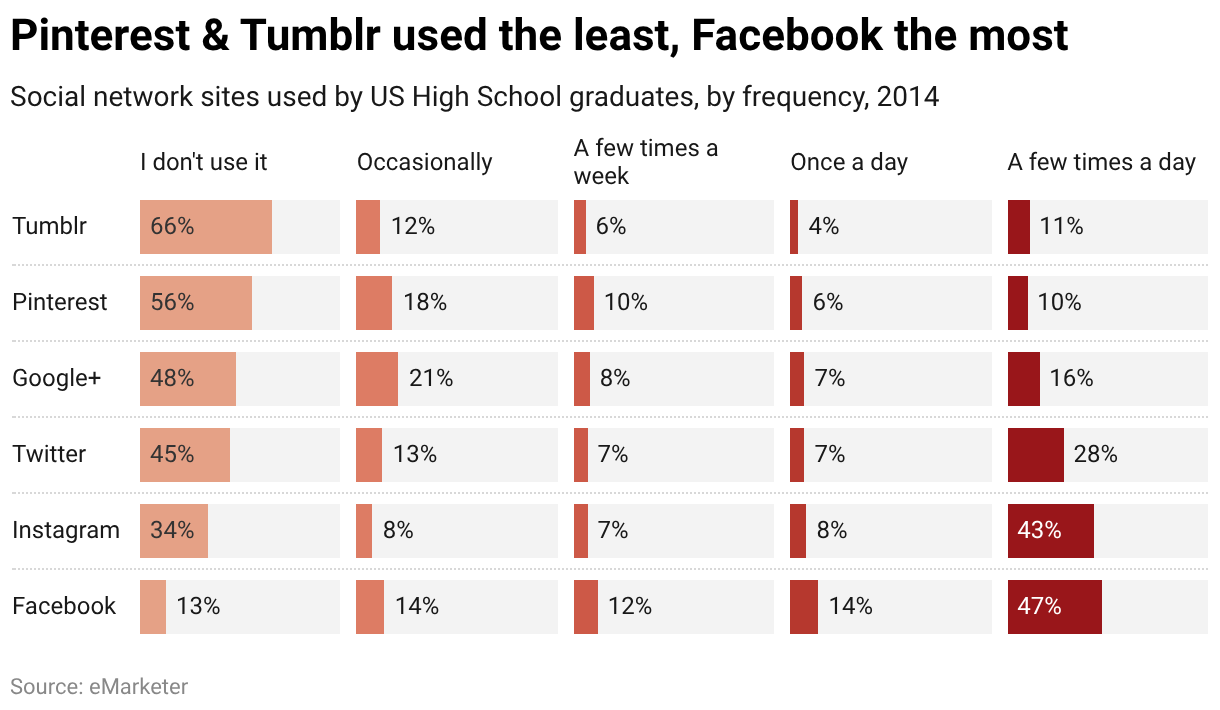
Unlike a regular bar chart, a split bar chart can show more than just one value for a category. Instead of creating five separate bar charts, you can instantly present the results for multiple values of one category in one chart.
Preparing your data
Formatting your data
For creating this chart type, you'll need:
- One header row containing descriptive labels
- One column containing categories. This will determine the label in front of each bar. In our case, that's the social network.
- At least two columns containing numeric values. Each number in your columns determines the length of the bar. You can have as many numeric columns as you like, but the more columns, the harder the chart will be to read on mobile devices, so consider aggregating your data into five or six columns. If you want to display just one column with data, use the regular bar chart type.
That's the data we used to create the chart at the top of the page:
| Social Network | I don't use it | Occasionally | A few times a week | Once a day | A few times a day |
| Tumblr | 66 | 12 | 6 | 4 | 11 |
| 56 | 18 | 10 | 6 | 10 | |
| Google+ | 48 | 21 | 8 | 7 | 16 |
| 45 | 13 | 7 | 7 | 28 | |
| 34 | 8 | 7 | 8 | 43 | |
| 13 | 14 | 12 | 14 | 47 |
Source: eMarketer
Uploading your data
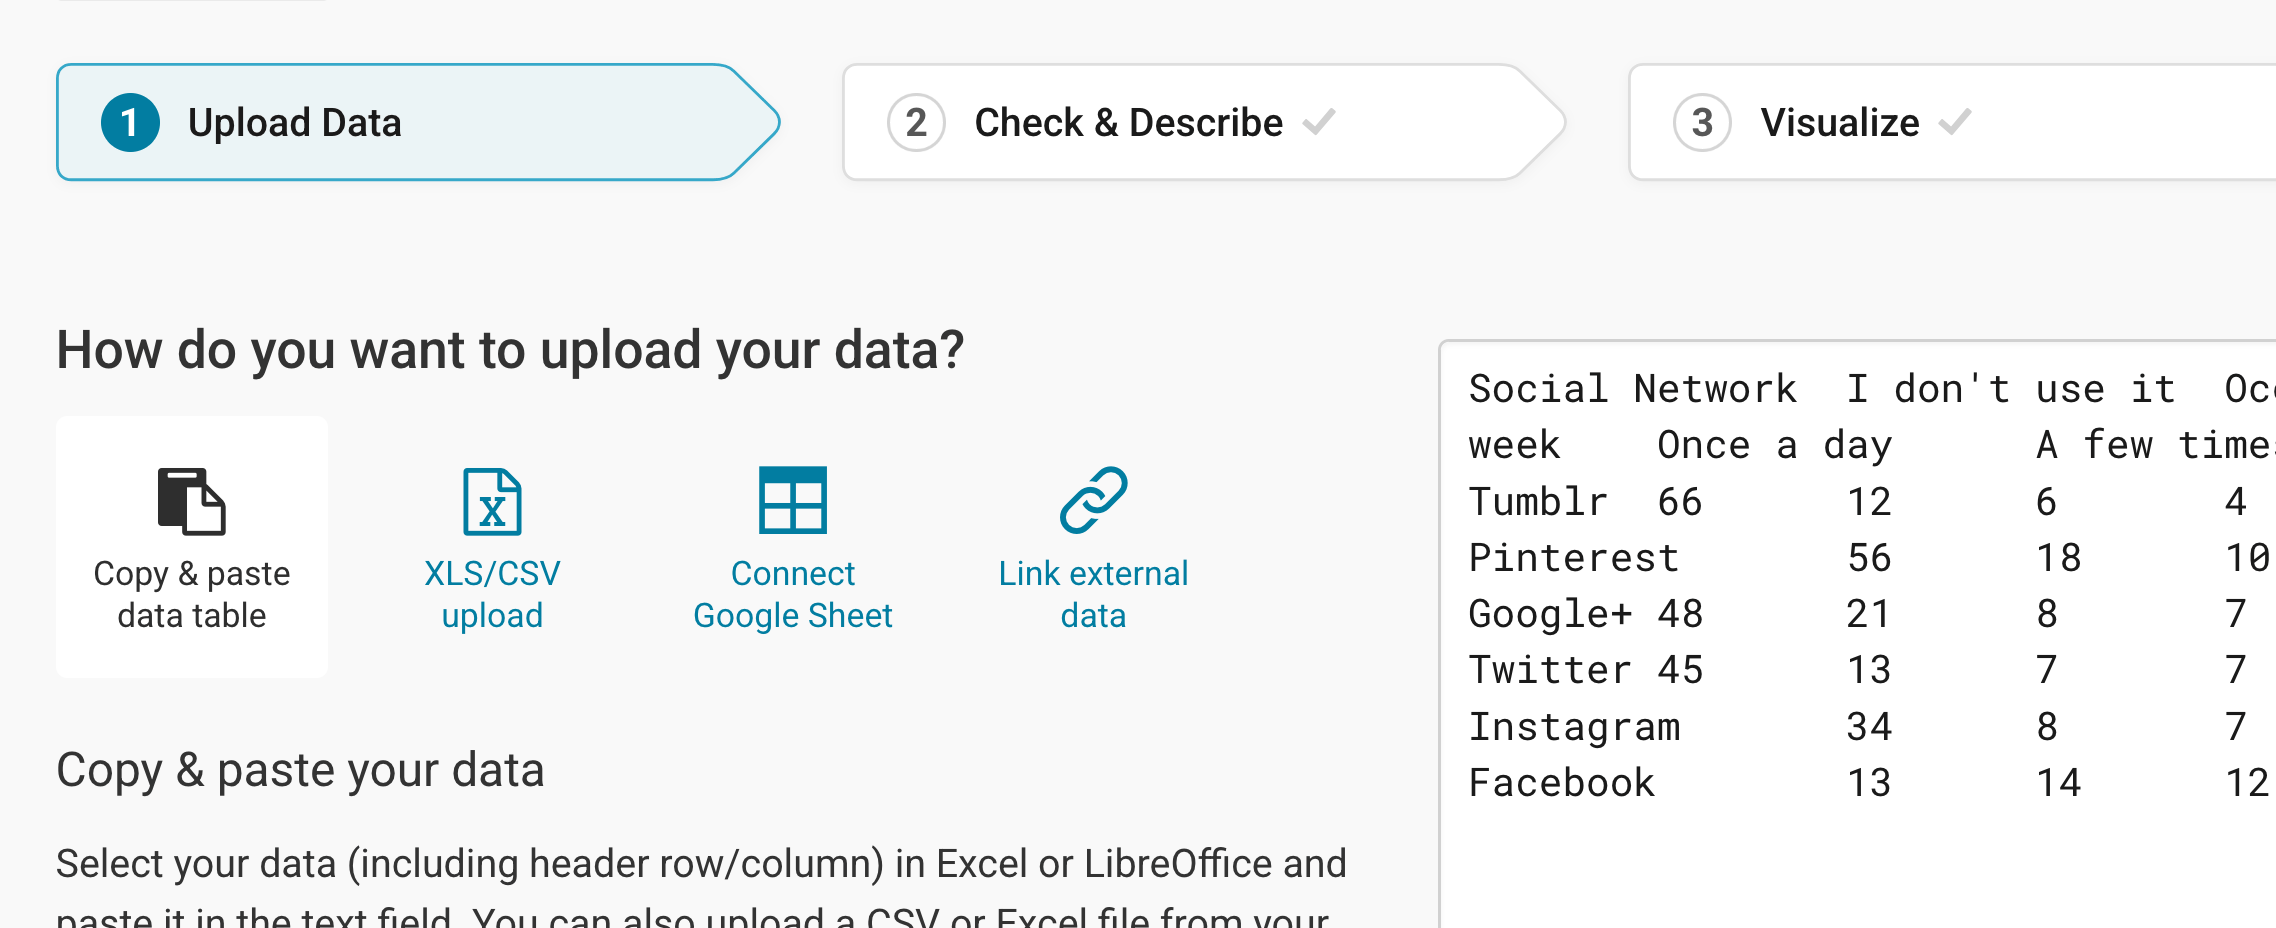
Once you have prepared your data, create a new chart in Datawrapper. You can do so by going to our homepage and clicking on Start creating. In Step 1: Upload, copy & paste your dataset, upload it as a .csv or as an Excel or Google Sheet. After pasting the data into Datawrapper, it will look like this:
Click Proceed at the bottom left to go to the next step:
Checking data and units
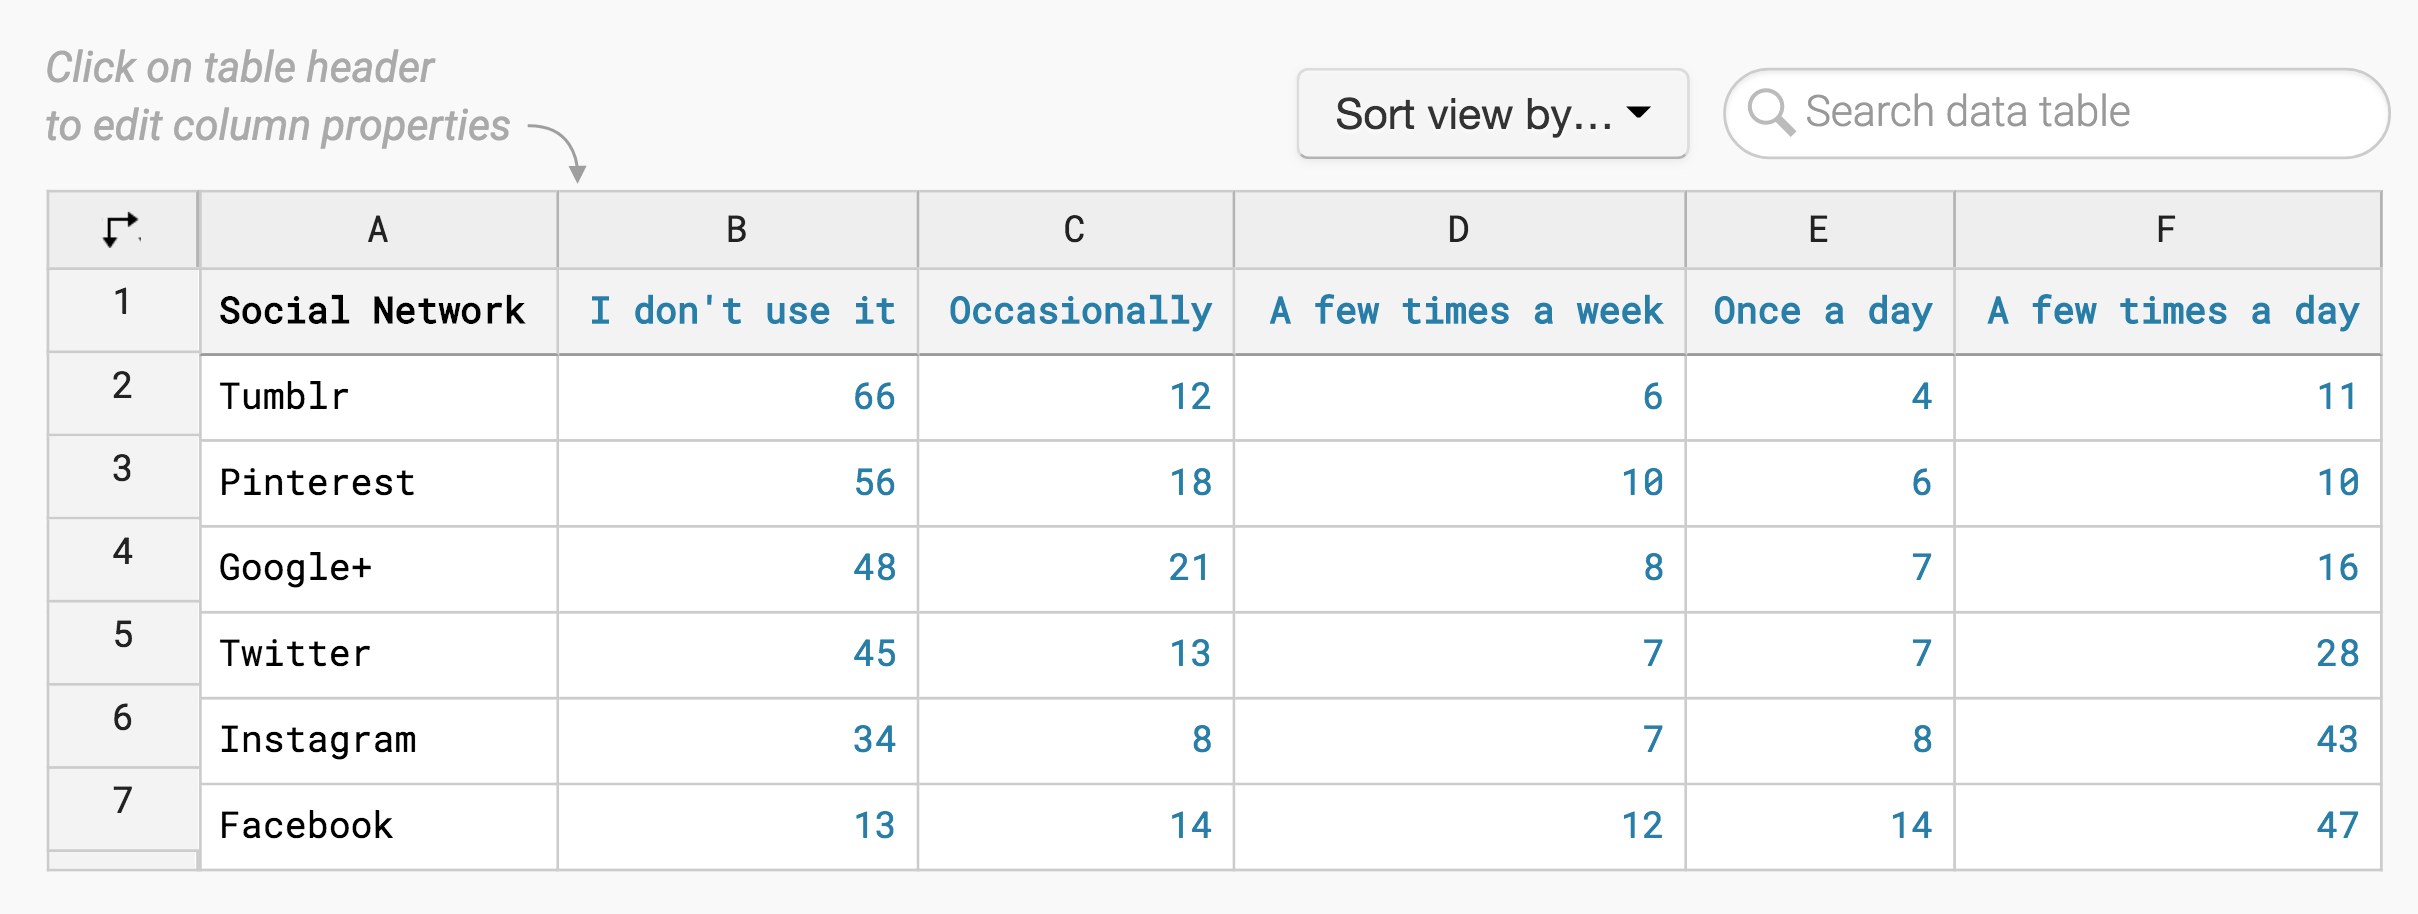
In the second step, you can check if your dataset was imported correctly and make changes to it, if necessary. If you did not upload a header row, you have to uncheck "First row as label" to avoid losing your first row of data. Always remember to do this if you don't have descriptive row and column headers.
In step 2, your data should look something like the screenshot below, automatically sorted into rows and columns. You can see that Datawrapper correctly recognized your numbers as numbers (and not as text or dates) because they are blue and are right-aligned. To learn more about Datawrapper's automatic recognition of data formats, visit this article.
To add a unit (like km/h, kg, inch, $, etc.) to your numbers, click on a column header and then add the unit of your choice to the Prepend/append options on the left. You can learn more about adding units to numbers here.
Click on Proceed at the bottom left to go to Step 3: Visualize:
Choosing a split bar chart
Now comes the fun part. Under the tab Chart type, you will see a grid of chart types displayed. Your data will probably be displayed as a line chart at first. To change that, click on the Split Bars symbol:
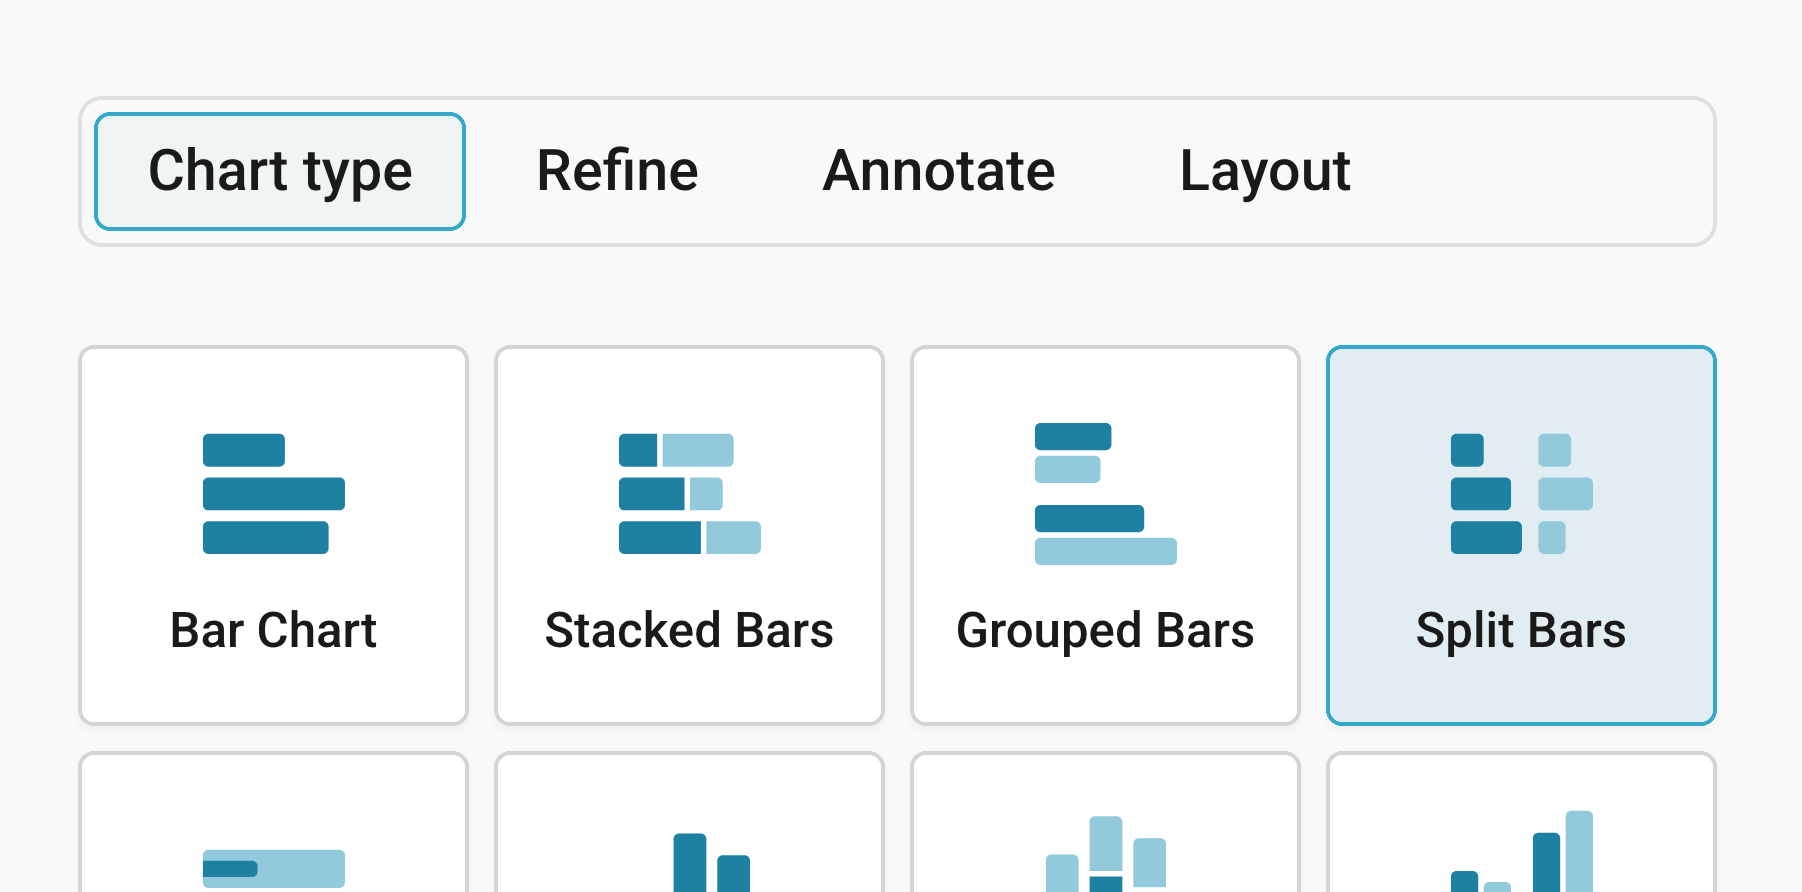
You will now see a split bars chart, without a title, descriptions or customized colors. The next step would be to further refine and annotate this chart. Besides Chart type, you'll notice three more tabs in this step: Refine, Annotate, and Layout.
Refining your chart
Resizing
In any tab of step 3: Visualize, you can click, hold, and drag the arrow in the lower right corner to scale the chart window or manually determine the dimensions of the chart by entering values in the boxes below the chart (Size).
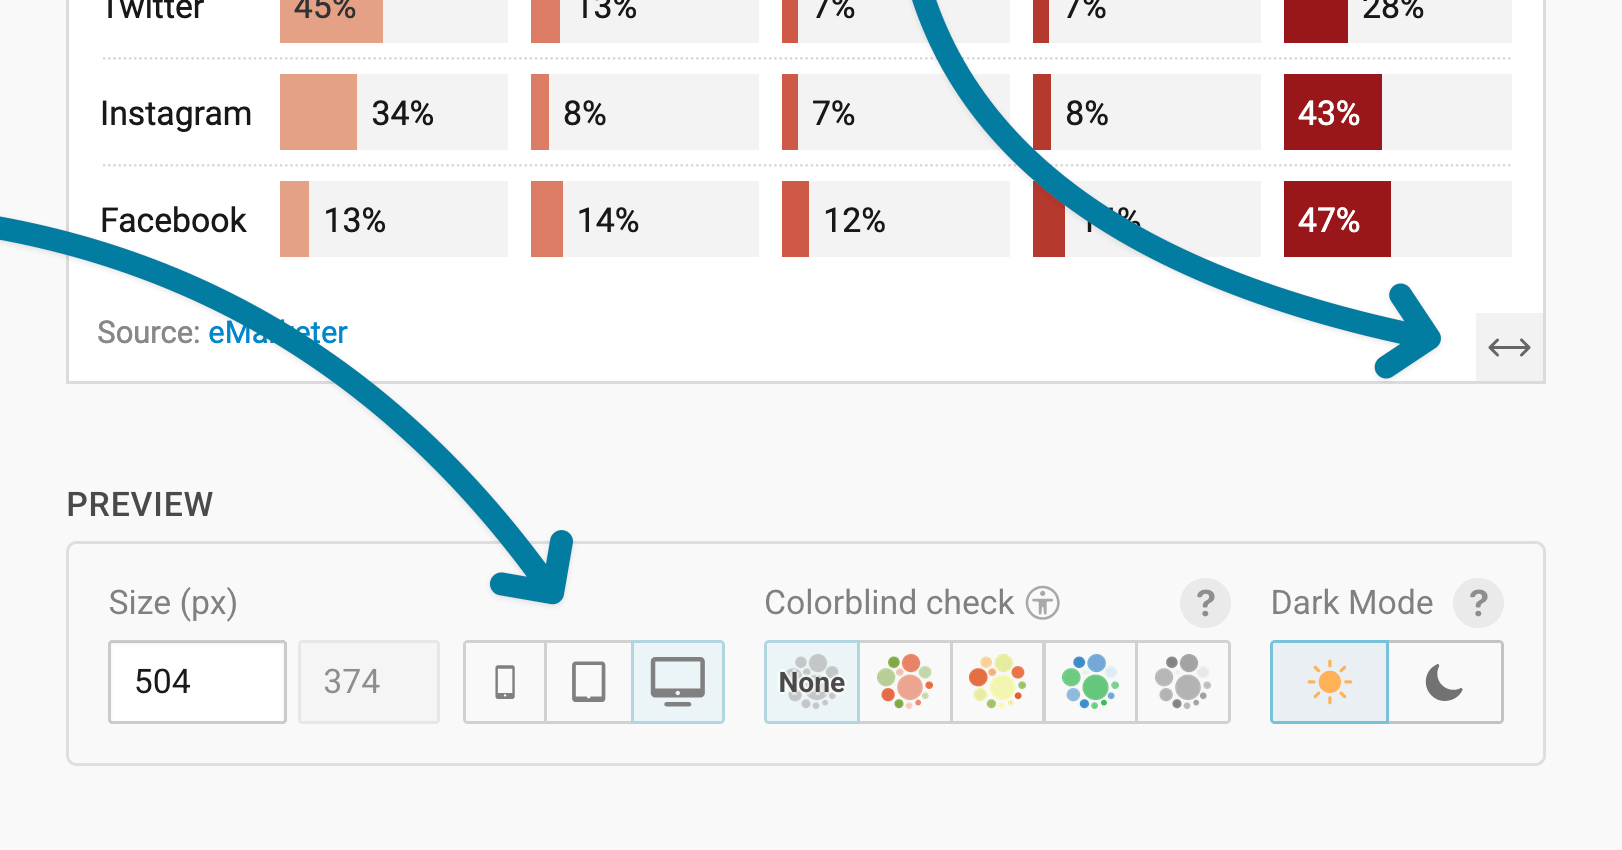
We recommend checking what the chart looks like on different screen sizes several times while designing it, by clicking on the little icons (mobile, tablet, and computer) below the chart.
Learn more about changing the width and height of your chart in this article.
Formatting labels
Let's continue with the Refine tab. Here, we see four panels: Labels, Horizontal axis, Appearance, and Sorting & Grouping.
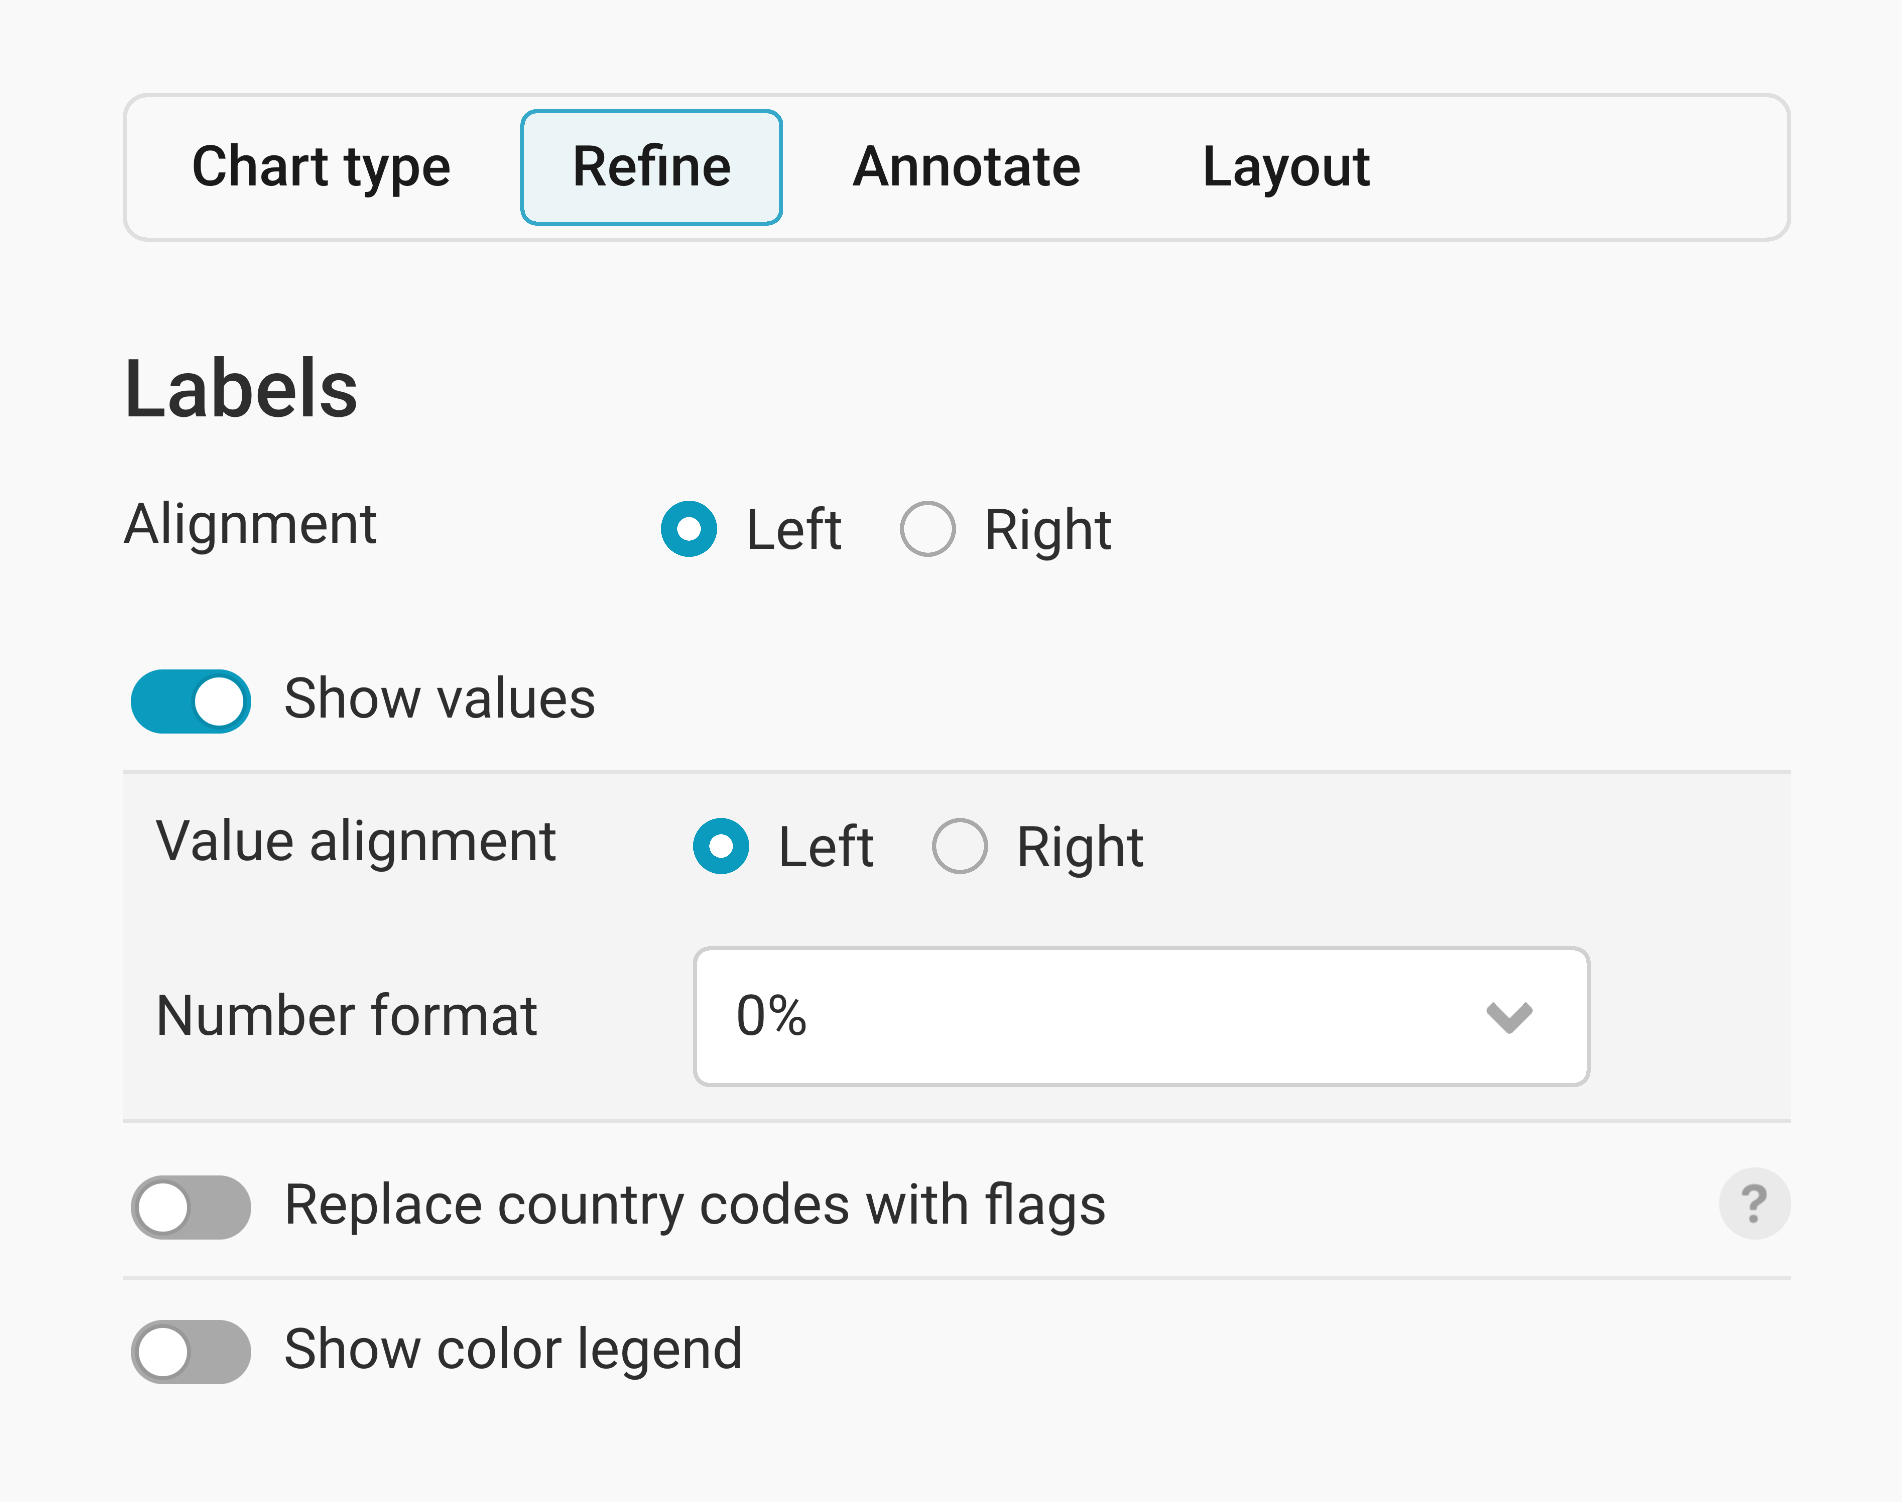
In the first panel, we can decide if we want to align the bar labels to the left or the right and if we want to show the values on our bars.
The most interesting setting if we decide to do so (it's on by default) is the Number format. With it, we can decide how our values are shown. Here are three examples:
- Choose the number format "123.4k" if you have big numbers like "1,303,428" that you want to display as "1.3m"
- Choose the number format "0.0" if you have very detailed numbers like "0.1922302" that you'd rather want to display as "0.2"
- Choose the number format "0%" or "0.0%" if your numbers are relative, like in our case, like in our case. This setting will add a percentage sign.
You can also decide to replace the country codes with flags, and to show a color legend. In most split bar charts, a color legend isn't necessary because the labels show up directly above the columns, so this is turned off by default.
Changing the axis range
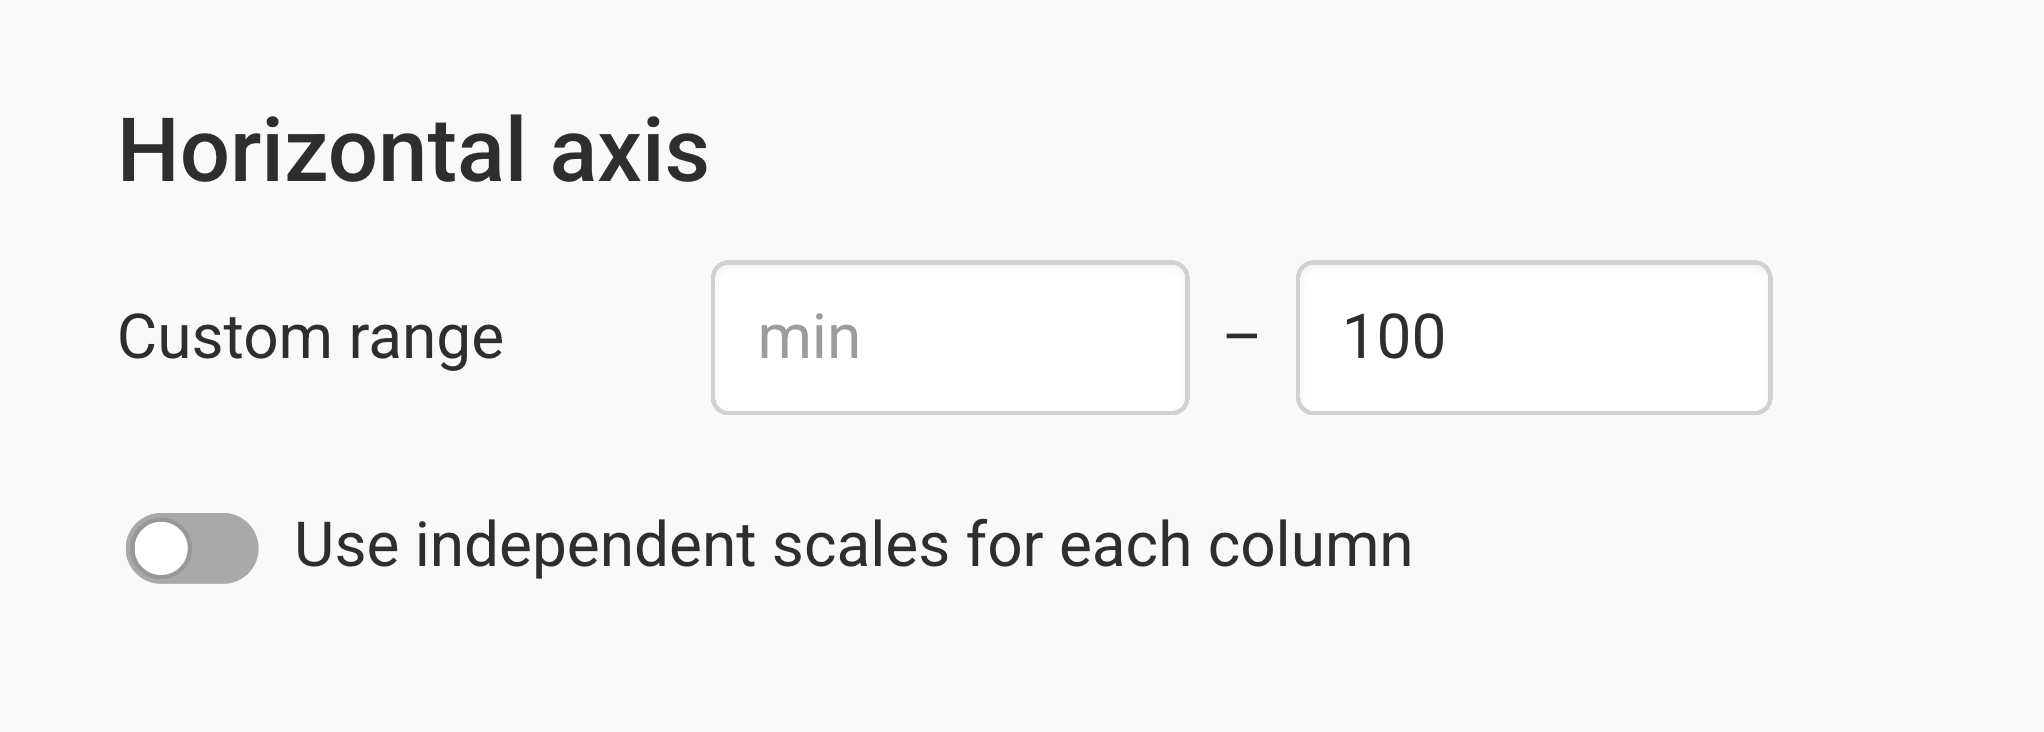
The next panel lets us customize our x-axis. Here we can choose which element in your chart shows which data.
First, with Custom range, you can decide which value range your x-axis should cover. By default, the x-axis for each column will be as long as your biggest bar. But if our chart shows percentages close to 100%, it makes sense to extend the chart to 100%. Readers will then be able to see how much is "missing" to reach 100%. So we can enter "100" in the max field.
If we have tiny values in certain columns and huge ones in others, we can also check the option Use independent scales for each column. Note that this will make it harder for our readers to compare the values across the columns with each other, and that it can lead to misread information. We will leave this option turned off for our chart.
Changing bar colors and appearance
In the third panel in the tab Refine, we can decide the design of our bar chart. Let's focus first on how to choose colors for our bars. After clicking on Customize colors, you can either color each column differently (the default) or each row (after clicking on Select column and then choosing the column in your dataset that contains the categories). Here's a video showing how:
In our chart, we decide to give a higher usage of a social network a darker color.
You can select and give the same color to multiple bars at the same time by highlighting them together. (If you want to highlight multiple items that are listed consecutively, hold down the Shift key while selecting. If the items are not in consecutive order, hold down the Ctrl (Windows) or Command (Mac) key while selecting.) You can also select colors by clicking on the colored boxes.
Below the color options, you can see the following:
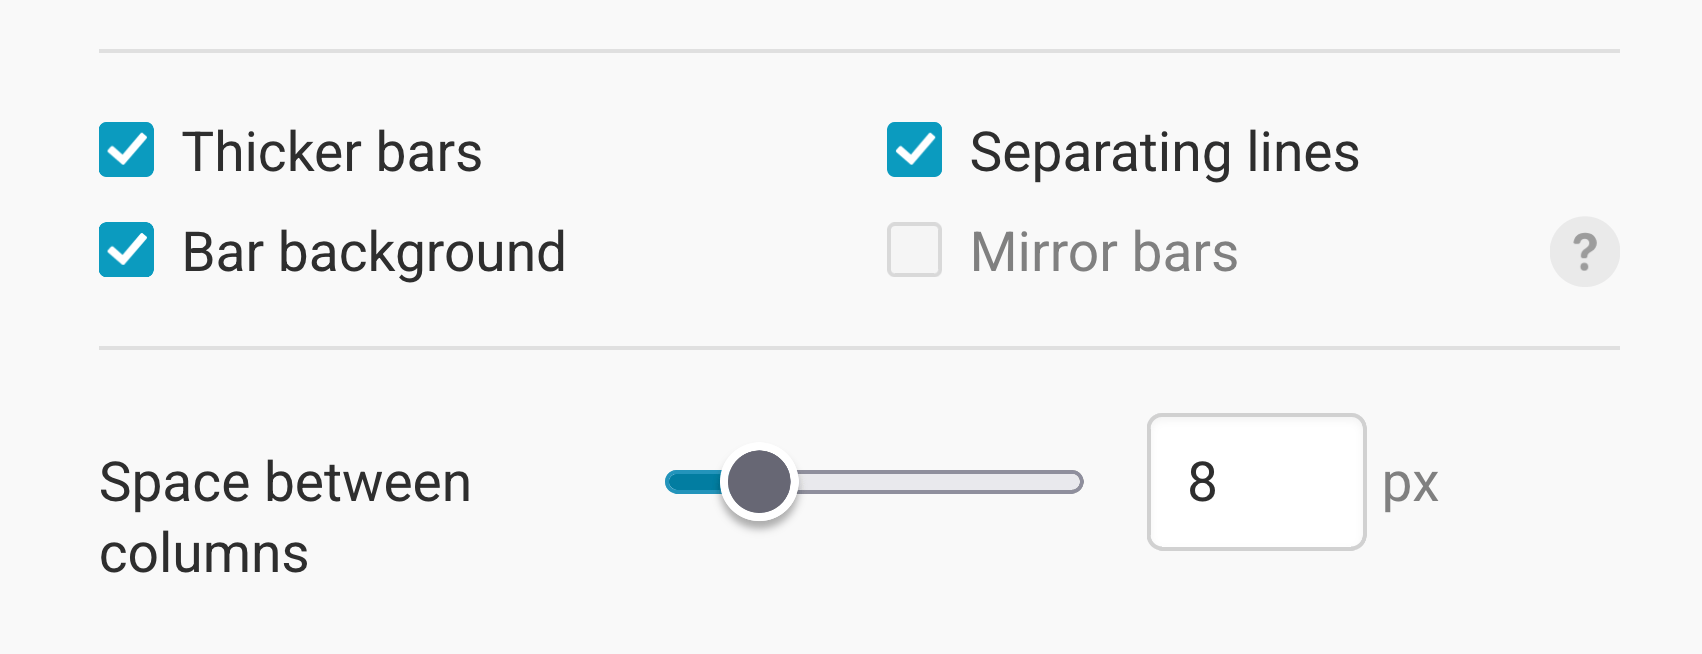
Here you can decide if your bars should be thicker, separated with a dotted line, and if there should be a gray background for each bar. This can be useful if you're showing a share and want to show "what's missing" between your values and 100% (make sure to set the custom range to 0-100). You can also increase or decrease the space between the columns. A cluttered chart can be cleaned up with these settings.
Sorting and grouping bars
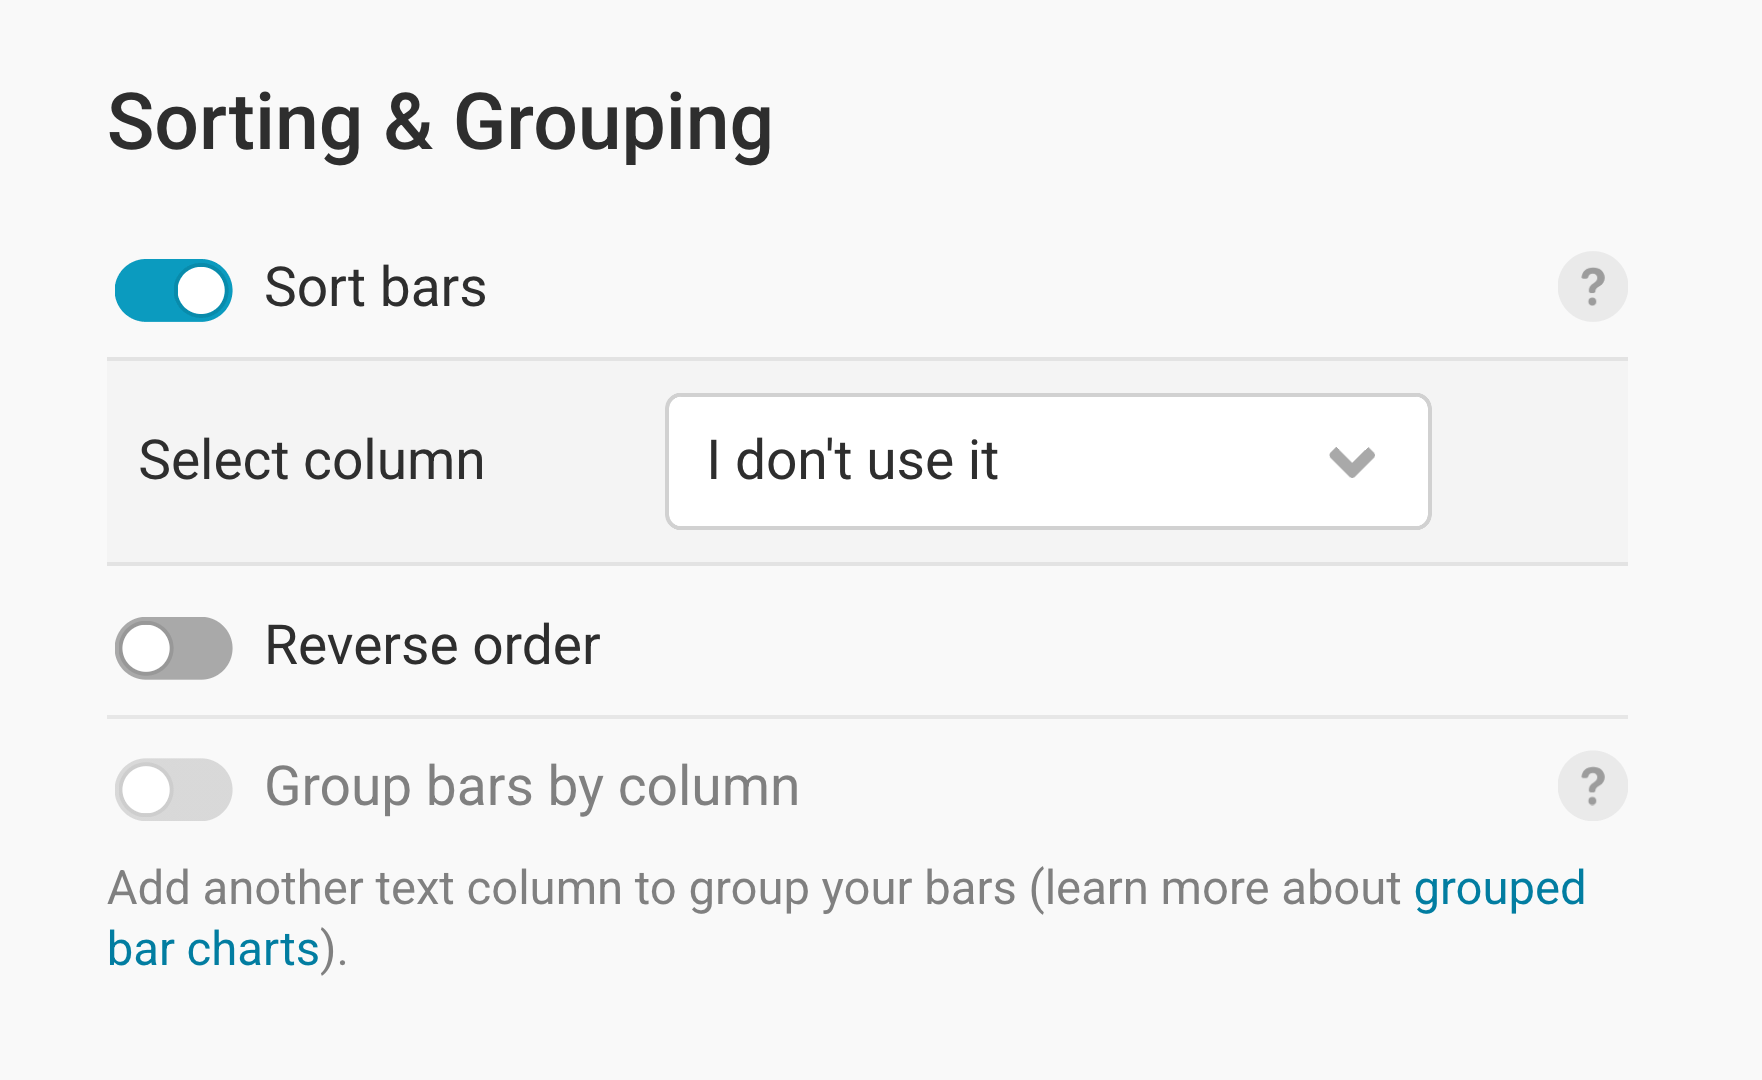
In the fourth and last panel, we can decide how to sort the order of your bars and labels and decide how you want to group them.
- Sort bars: You can keep the order of your spreadsheet by leaving this option unselected. If you select this option, you can choose the column you want to sort the bars by. In our chart, we can choose to sort the bars by the first column "I don't use it," which will make the biggest value come at the top of the chart.
- Reverse order: If you select this option, you will have the largest bar at the bottom.
- Groups: You can upload an extra column to put categories into extra groups. In our case, we could have a column that states for each social network if it's been around "before 2010" or "after 2010". If we choose that column as our "Groups", the chart would make a separation between the bars showing the "old" social networks and the younger ones. Learn more about grouping bars here.
And that's all for the Refine tab! Let's continue with the Annotate tab.
Annotating your chart
Adding a title and source
In the Annotate tab, you're first asked to give your visualization a title, description, notes, source, byline, and an alternative description for screen readers. You can find a detailed explanation of all these Annotate options here.
Highlighting bars
In the 2nd panel in the Annotate tab, you can choose to highlight elements: The label in front of these bars will appear in bold. You can revert the highlight by clicking on the x in front of the label:
Adding text annotations
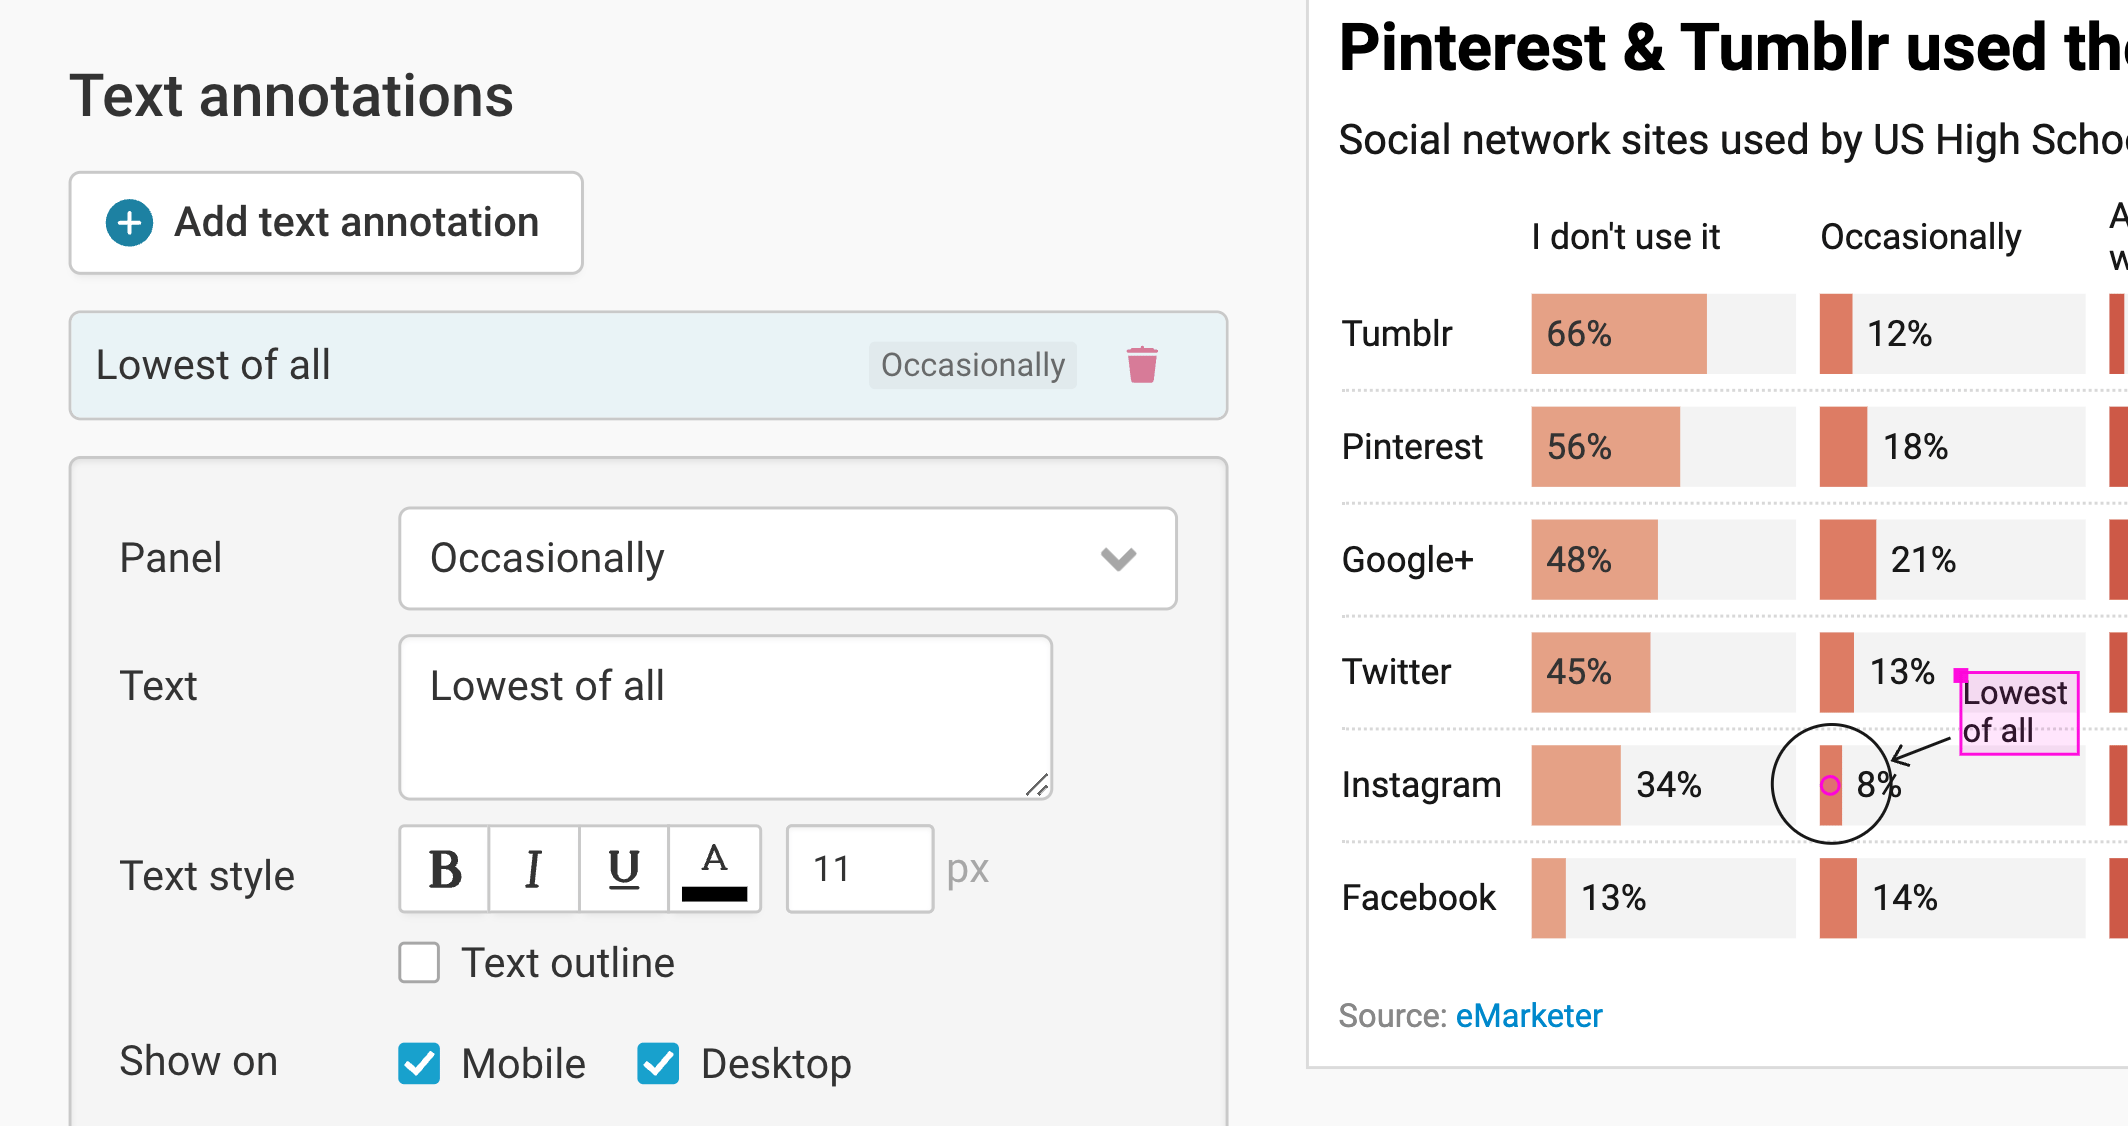
You can add annotations to your split bar chart by clicking on Add text annotation. You can then style and move the text, add an arrow and circle to it, and adjust how it will appear on mobile. Here's an in-depth explanation of all the options.
Highlighting ranges
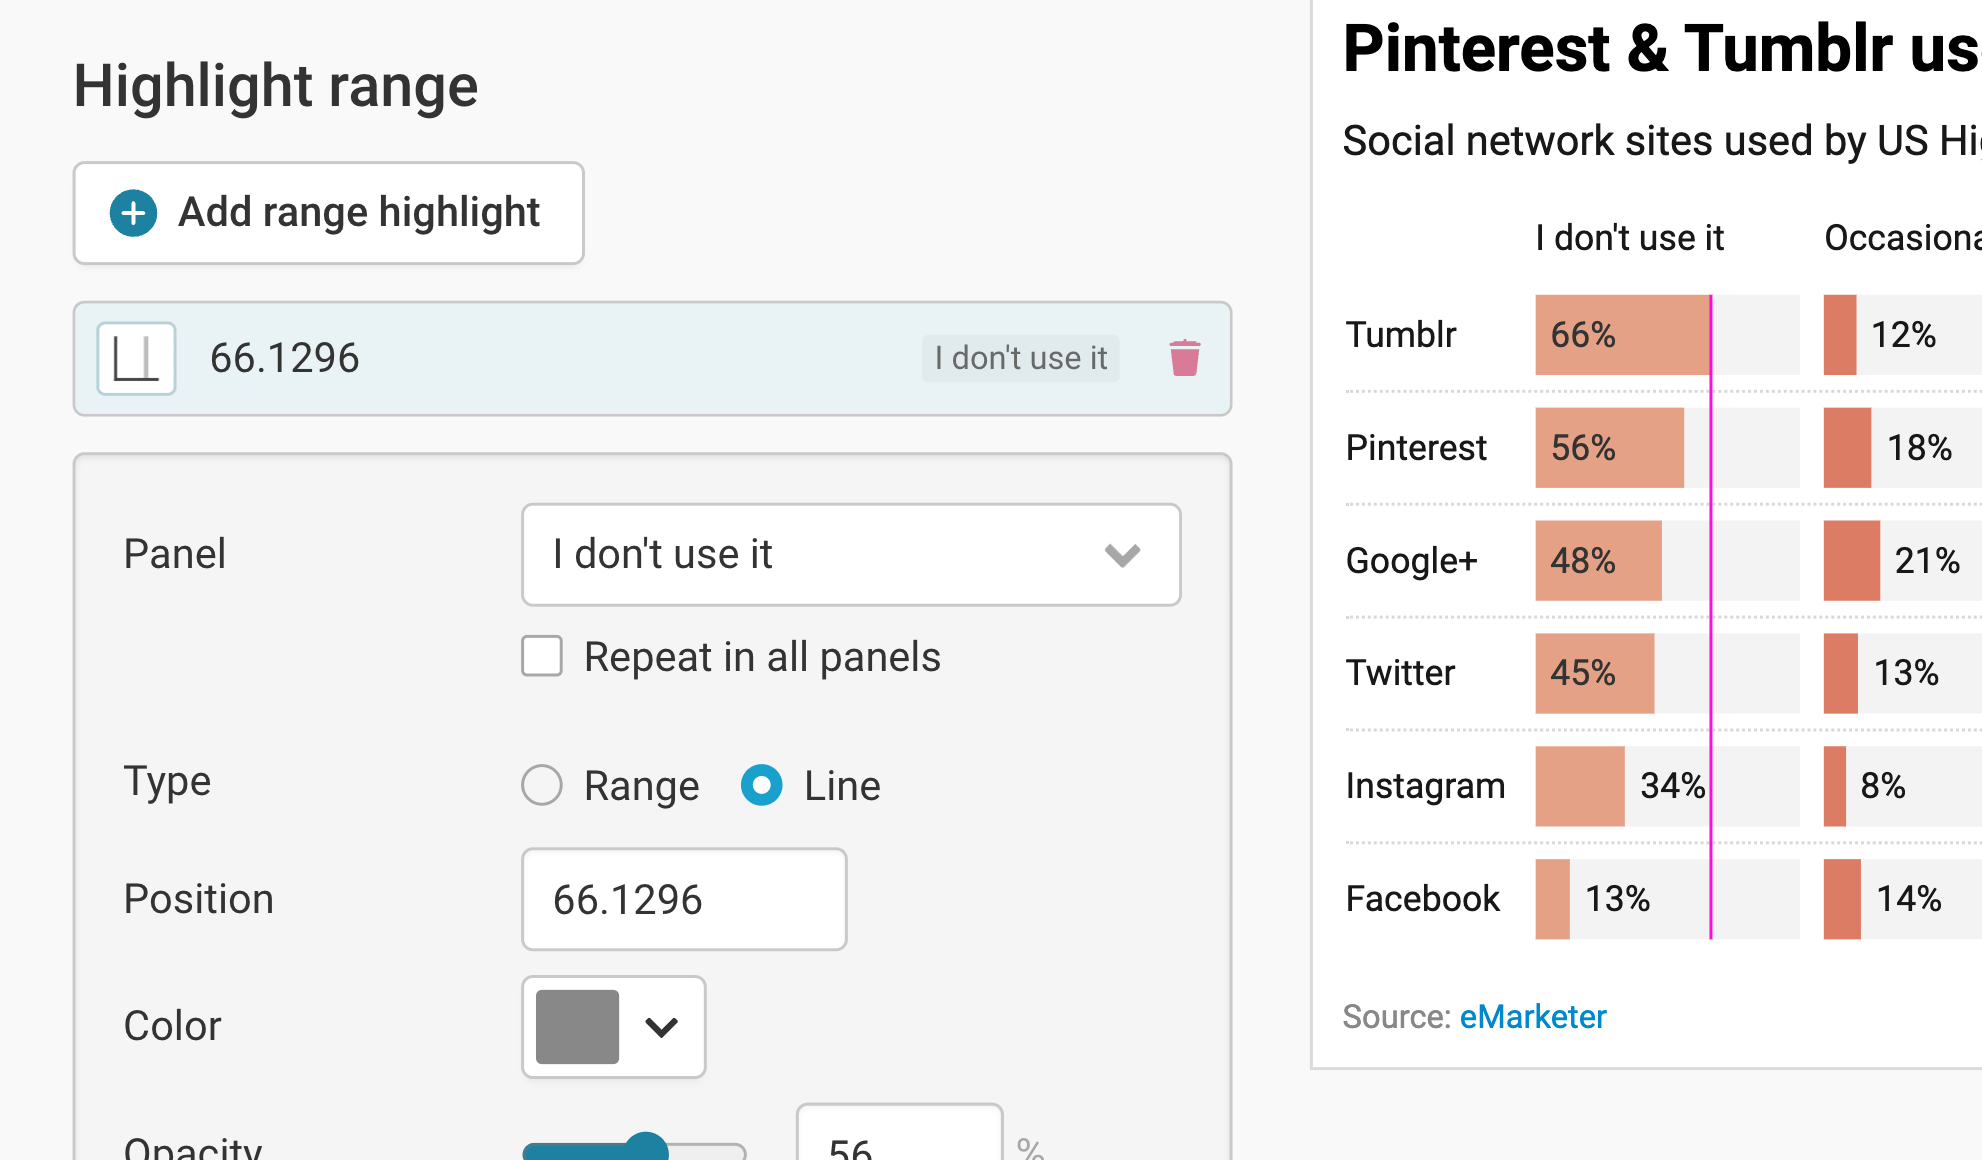
You can add a range or line highlight by clicking on Add range highlight and then dragging on the chart where you want the highlight to be. You can then change its position, color, opacity, and line width and style, or delete it again. Here's an in-depth explanation of all the options.
Publishing your chart
In the Layout tab, you can select an output locale, change the design theme and footer options, and enable social sharing. Find a detailed explanation of all the Layout options here.
In the final step 4: Publish & Embed, you have the option to publish the chart either by sharing the URL or by pasting the embed code directly into your website or CMS (recommended). You can also download your chart as a PNG (available to all users regardless of the type of subscription plan they have) or as an SVG or PDF (available only to users of paid plans). For more information on the different pricing plans, click here.
And that's it! You've successfully created and customized your first split bar chart.