How to create a multiple columns chart
- Free
- Pro
- Business
- Enterprise
Column charts might be the easiest to read chart type out there, and can work for both showing data about categories and data that develops over time. Multiple column charts – also called small multiple column charts, trellis plot, facets, grid charts, or panel charts – are column charts where each series gets its own panel. They're a good choice if you want to show many categories (too many for e.g. a grouped column chart), and if you want to enable readers to compare numbers within a category (instead of the total).
In short, multiple column charts are great to show lots of series and categories and keep a tidy appearance.
👉 To learn more about Datawrapper multiple columns, read our feature announcement from February 2025.
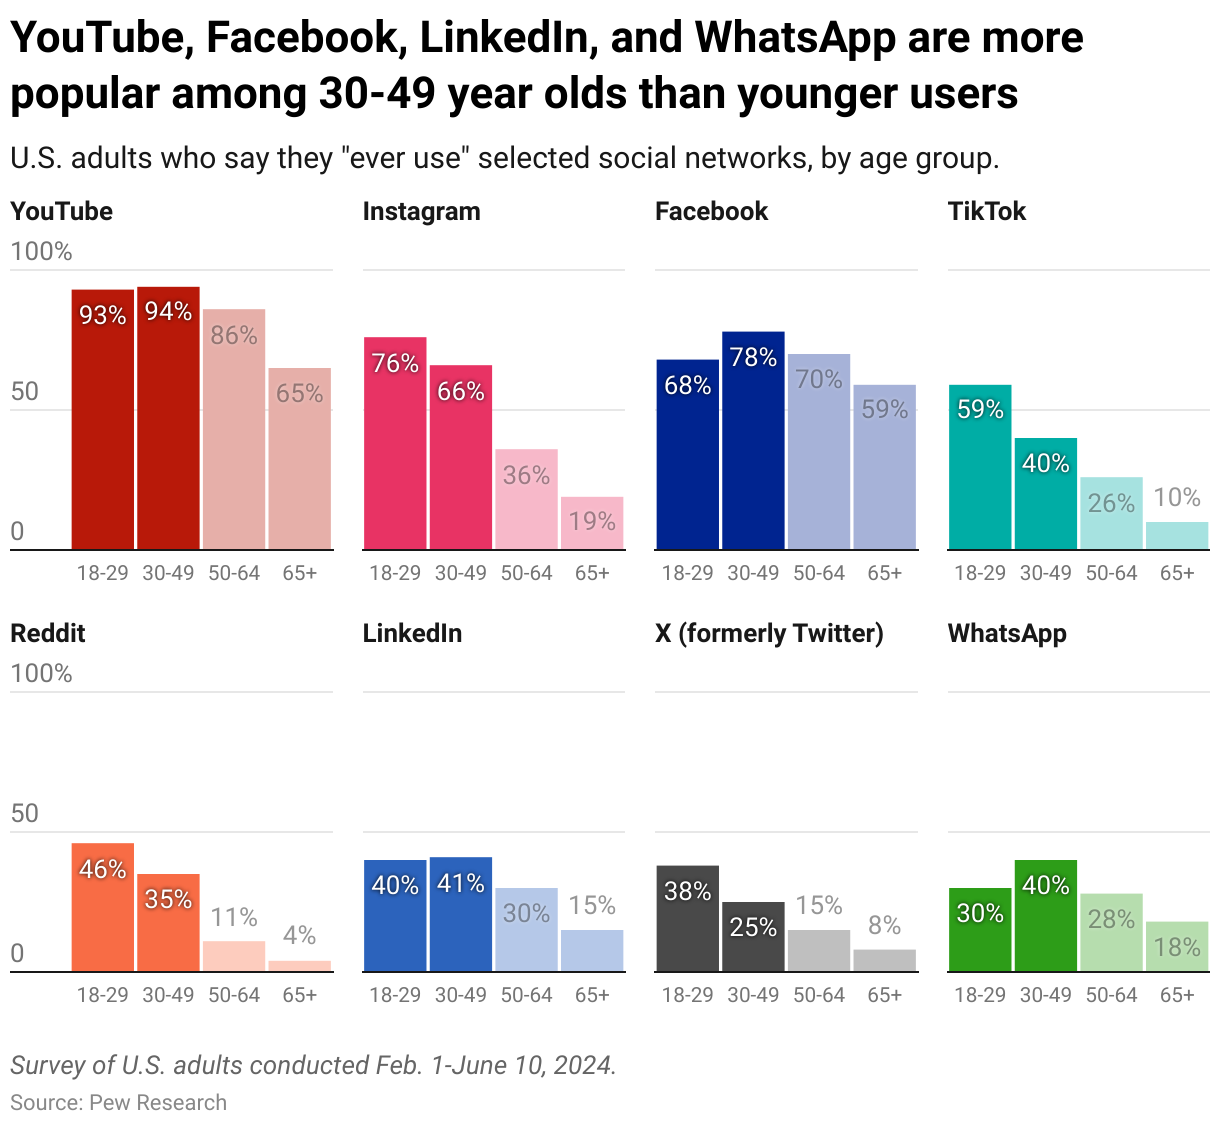
This guide will show you how to create and customize the following chart:
Preparing your data
Formatting your data
To visualize data, you first need the data. The source for the chart on social media usage is Pew Research, and you can download it by clicking on Get the data at the bottom of the chart. The data looks like this:

To make sure that Datawrapper accepts the data, your data should have the following:
- A header row with labels. These will show up as titles above each chart panel (e.g. "Facebook", "Instagram").
- A first column with dates/times or categories. They will define the horizontal axis. Learn here which date formats Datawrapper recognizes. The more rows you have, the more columns your final chart will show in each panel. In our case, each panel will have four columns, because there are four rows.
- Columns with values. They will define each column series and the length of the vertical axis. The more columns you have, the more panels your final chart will have.
Uploading your data
Once you have prepared your data, create a new chart in Datawrapper. You can do so by going to our homepage and clicking on Start creating. In step 1: Upload, you can copy & paste your dataset, upload it as a .csv or Excel file, or connect to a Google Sheet. For now, you can just copy & paste the data:

The data looks a bit chaotic in there, so let's quickly move on.
Checking data and units
Once you click on step 2: Check & Describe or on Proceed, you'll see that Datawrapper puts your data into a neat table:

As explained in the upper left of step 2, Datawrapper automatically detects data formats (number, dates, or text) and empty cells. The first column is green, which tells you that Datawrapper correctly identified the dates as dates. The rest of the columns are blue and right-aligned, meaning Datawrapper recognized them as numbers.
You can always change the data format by clicking on the table header and selecting another one.
To add a unit (like km/h, kg, inch, $, etc.) to your numbers, click on a column header and then add the unit of your choice to the Prepend/append options on the left. You can learn more about adding units to numbers here.
For now, that looks good, so let's click on step 3: Visualize, to see your data visualized:
Choosing a multiple columns chart
In step 3: Visualize, Datawrapper will always show you your data as a line chart.
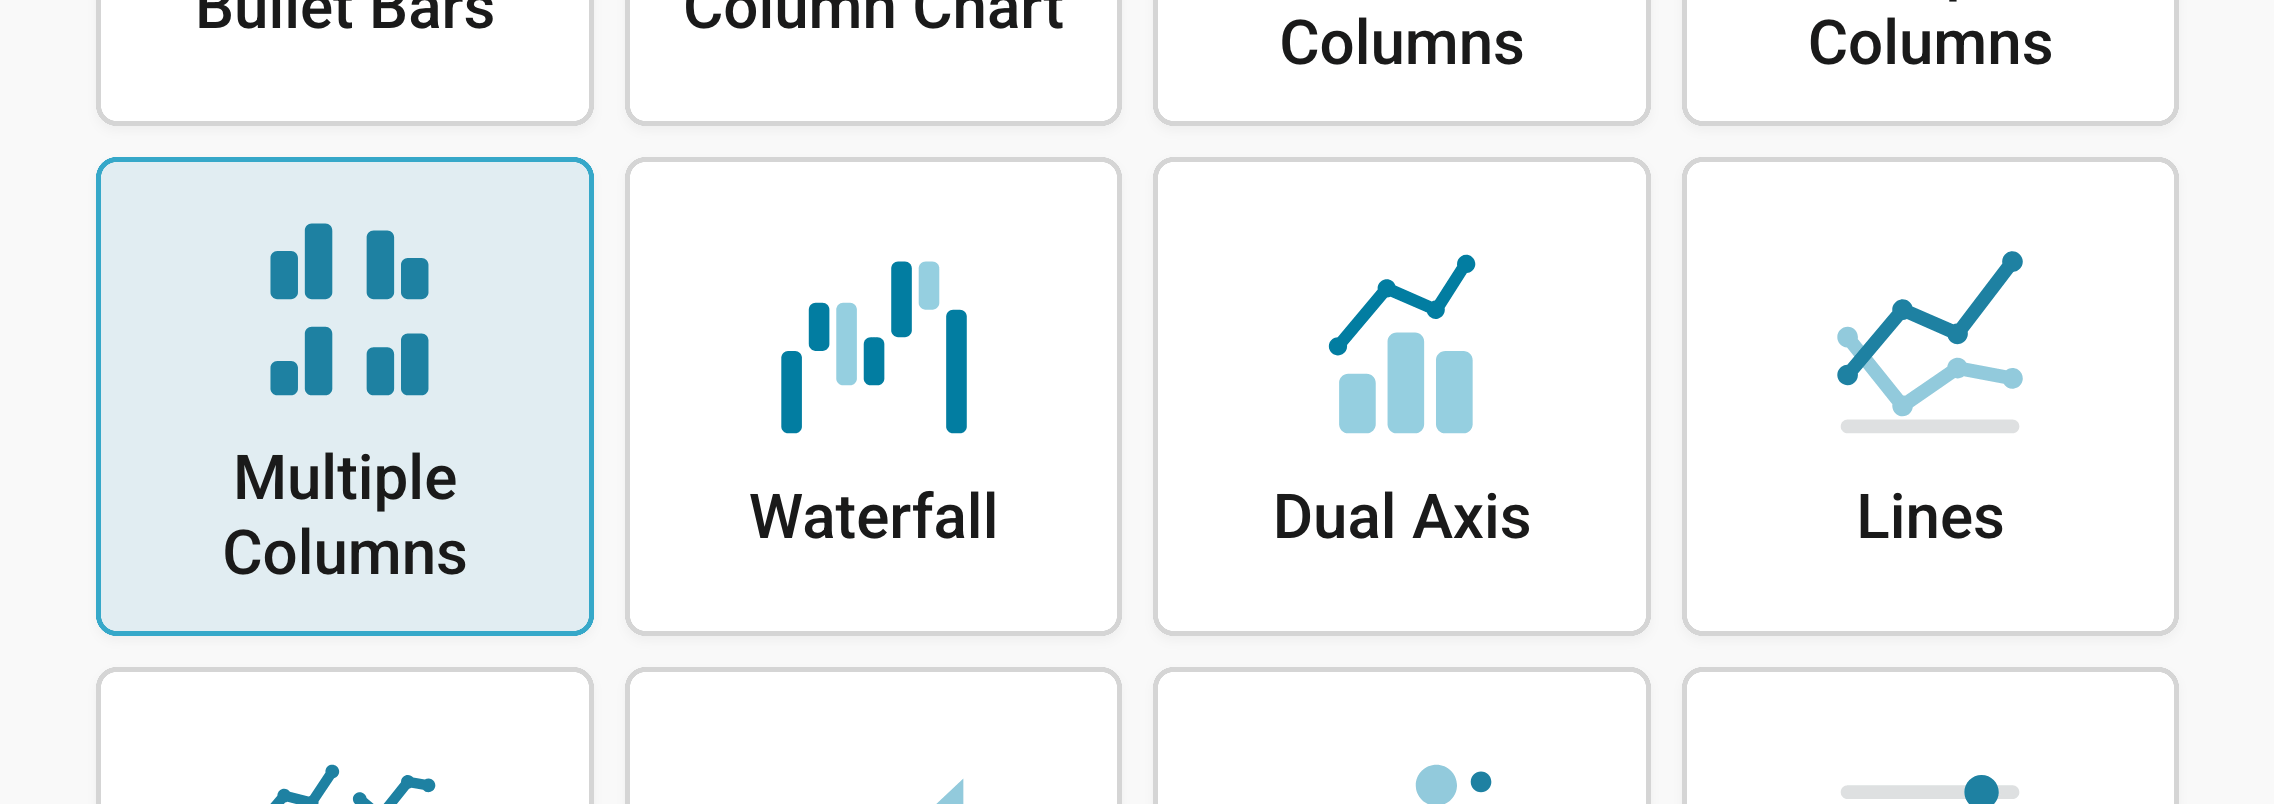
Click on any of the other chart types to see your data visualized differently. To create a small multiple column chart, make sure to click on Multiple Columns:
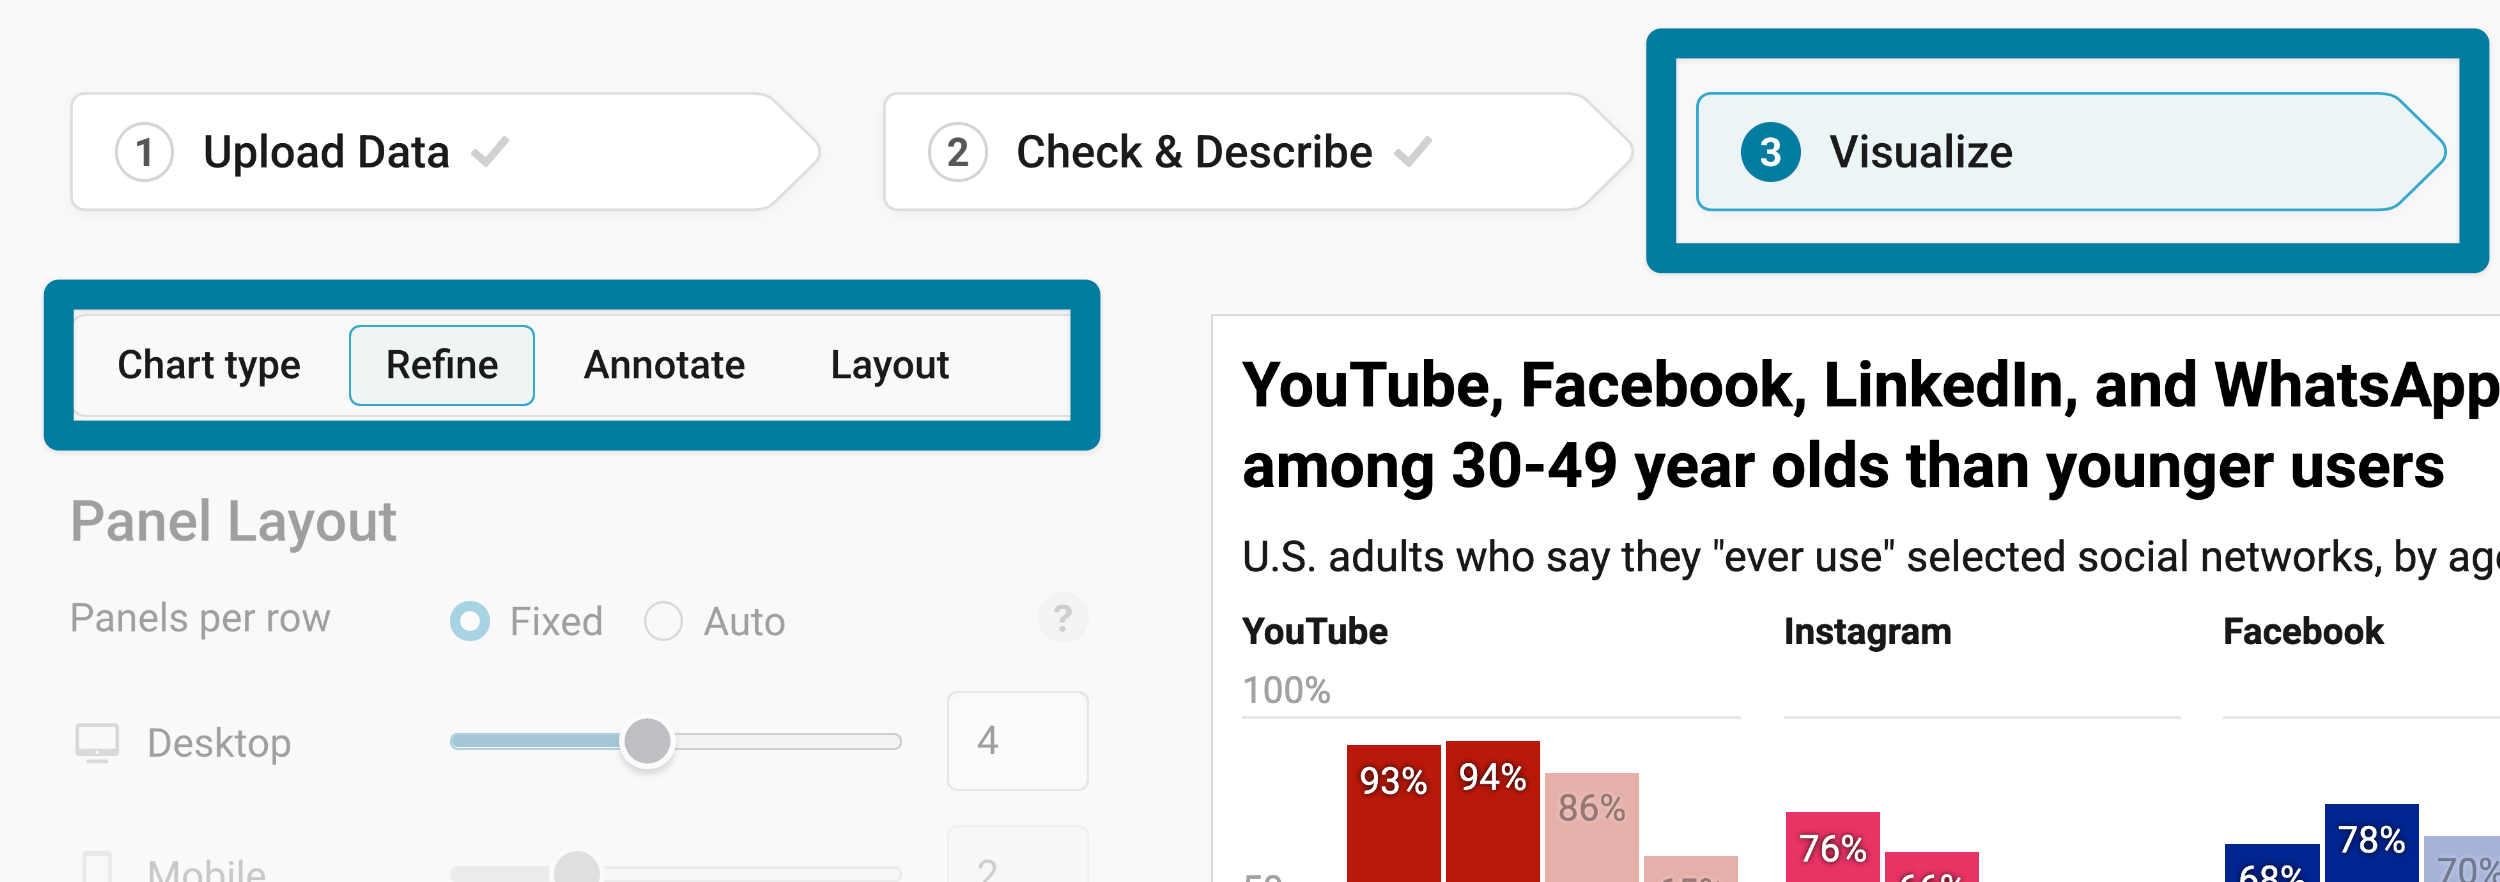
Besides Chart type, you'll notice three more tabs in this step: Refine, Annotate, and Layout.
Resizing
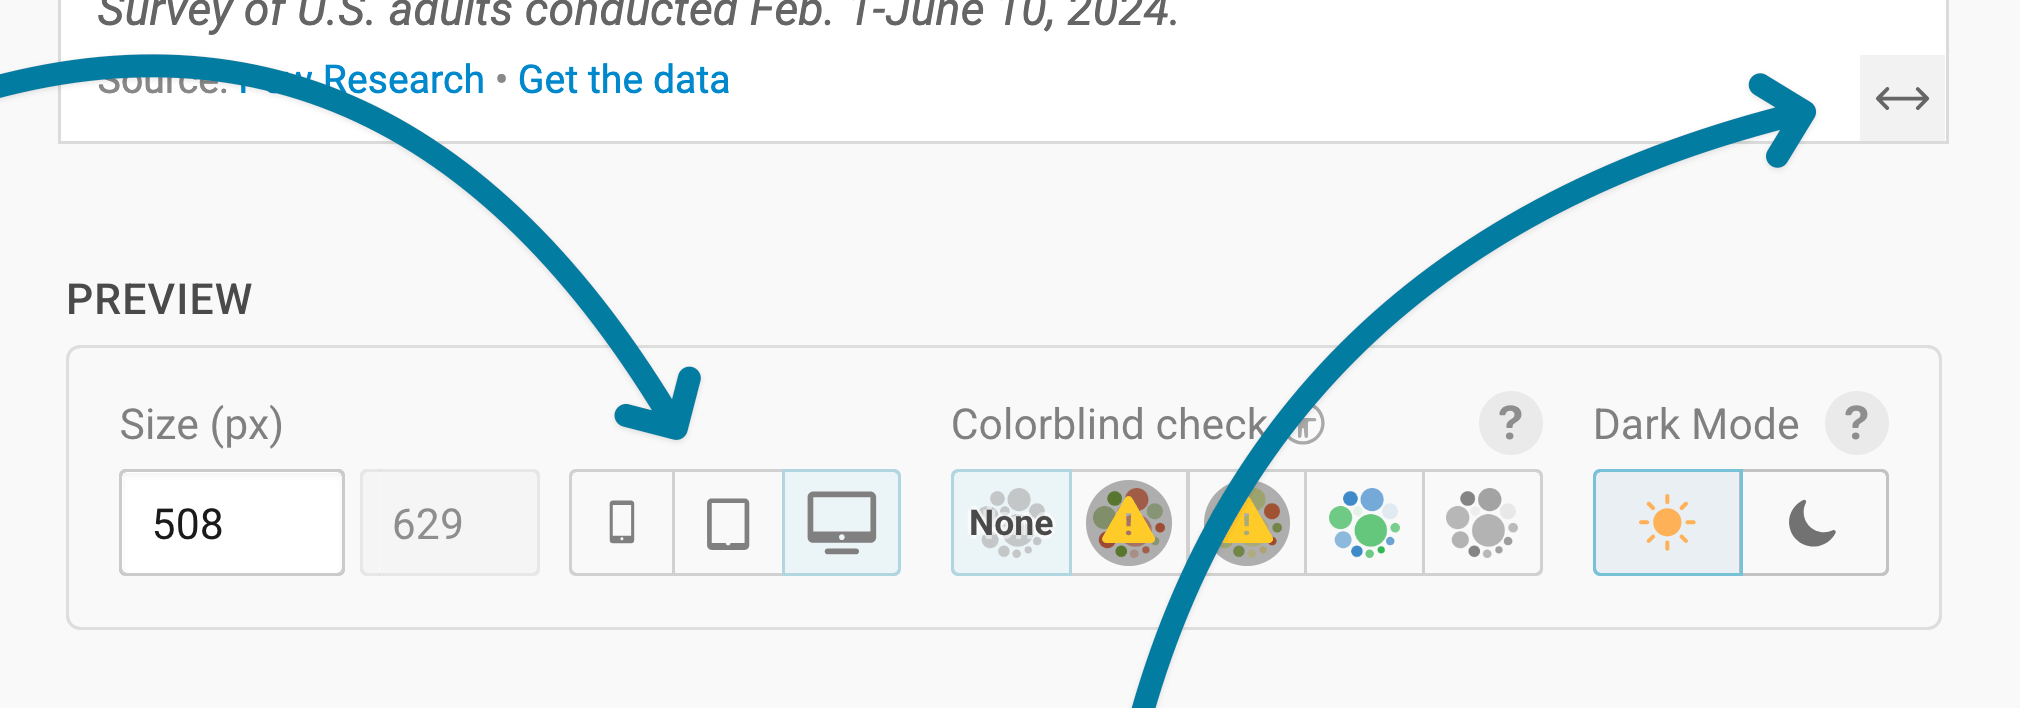
In any tab of step 3: Visualize, you can click, hold, and drag the arrow in the lower right corner to scale the chart window or manually determine the dimension of the chart by entering values in the boxes below the chart (Size).
We recommend checking what the chart looks like on different screen sizes multiple times while designing it, by clicking on the little icons (mobile, tablet, and computer) below the chart.
Learn more about changing the width and height of your chart in this article.
Refining your chart
Let's continue with the Refine tab. Here, we see eight panels: Panel layout, Horizontal axis, Vertical axis, Columns, Panels, Labels, Overlays, and Tooltips.
Changing the panel layout
Panels are the "mini column charts" of your small multiple column chart. Each panel shows (at least) one column and a panel title. In the first section, Panel Layout, you can decide how big each panel should be and in which order they should appear:
Panels per row: Here you can control the number of columns of your chart for both desktop and mobile readers.
You have two options:
Fixed is the default. It lets you choose the exact number of panels for mobile and for desktop readers.
For example: You can decide that your reader should see five panels when the chart is wider than 500px ("desktop"), and three panels if the chart is narrower. Then:
- When your chart is 300px wide, it shows 3 columns
- When your chart is 500px wide, it shows 5 columns
- When your chart is 900px wide, it also shows 5 columns, etc.
Auto lets you choose one minimum size for all panels.
For example: If you set the panel size to 200px, then
- When your chart is 300px wide, it shows 1 column
- When your chart is 500px wide, it shows 2 columns
- When your chart is 900px wide, it shows 4 columns, etc.
You can change the width of your chart by changing the Preview size below the chart, or by dragging the arrow in the lower right of the chart to the left and right. We recommend that you set the chart width to the size your final chart will appear in for most readers (e.g. your article width).
Panel height sets the height of each panel/row of panels. Here, too, you have two options:
Fixed: The height of the panel is always the same. For example, if you choose a fixed panel height of 140px, your panels will always be exactly 140px tall, no matter if they are 200px or 300px wide.
Based on width: The height of your panels is based on their width. The wider the panel, the taller your panel. For example, if you choose 100%, then the panel will always be square. If you choose 200%, the panel will always be twice as tall as it is wide.
Sort panels lets you decide in which order your panels should be. You have the following options:
- Start sorts by the first value in each panel.
- End sorts by last value.
- Difference sorts by absolute difference between first and last values.
- % change sorts by relative difference between first and last values.
- Range sorts by absolute difference between highest and lowest values (min and max value).
- Title sorts by panel title alphabetically.
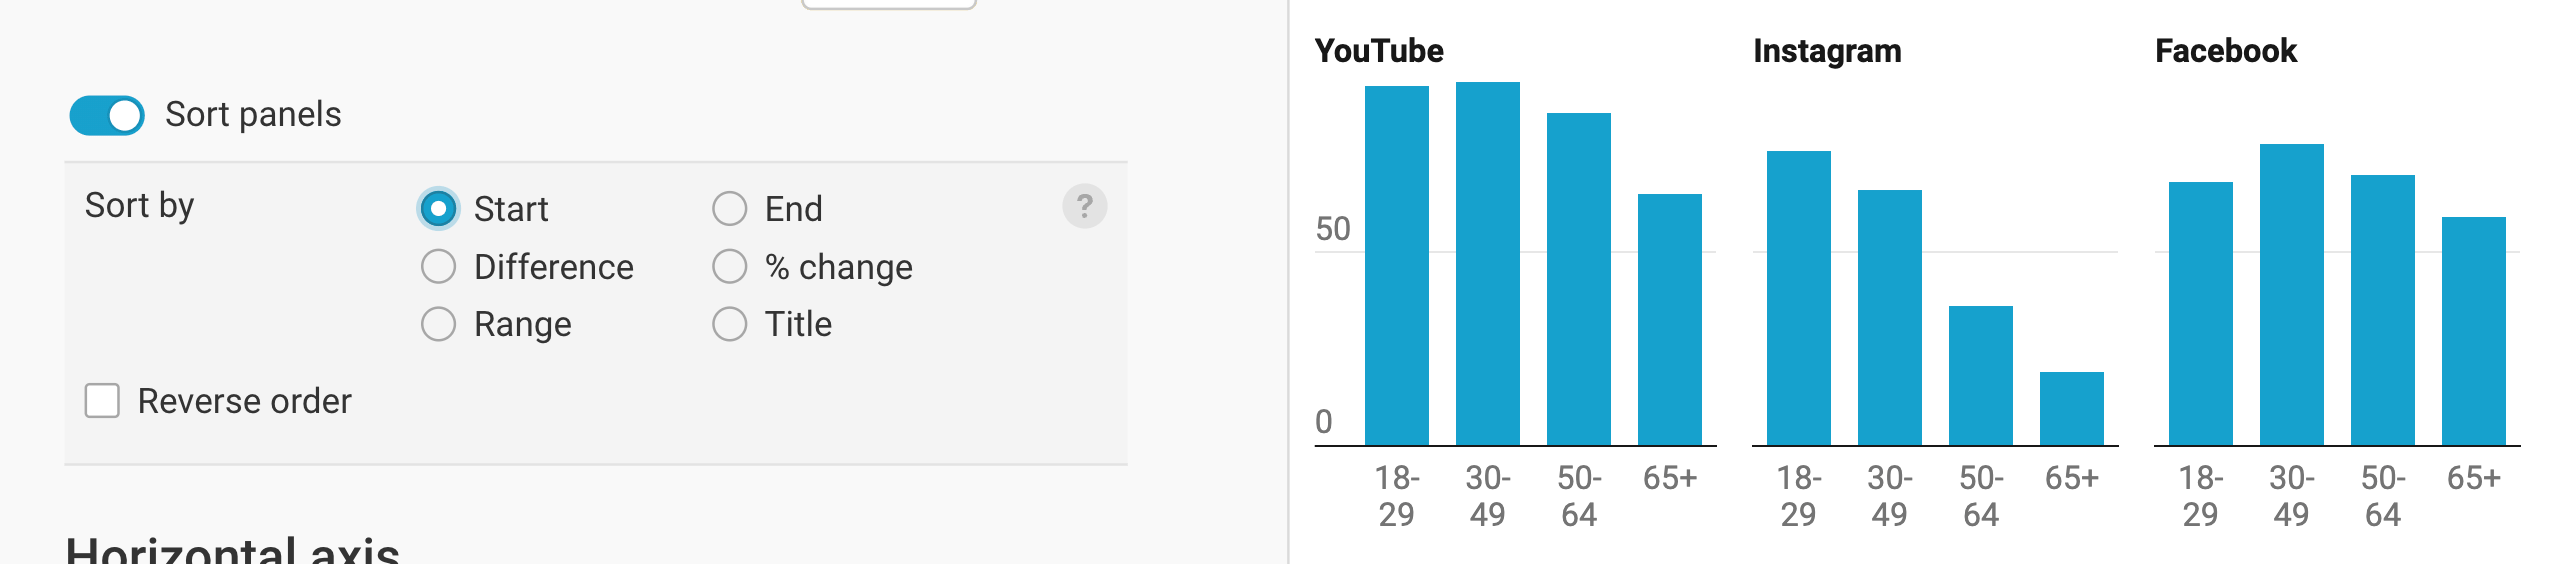
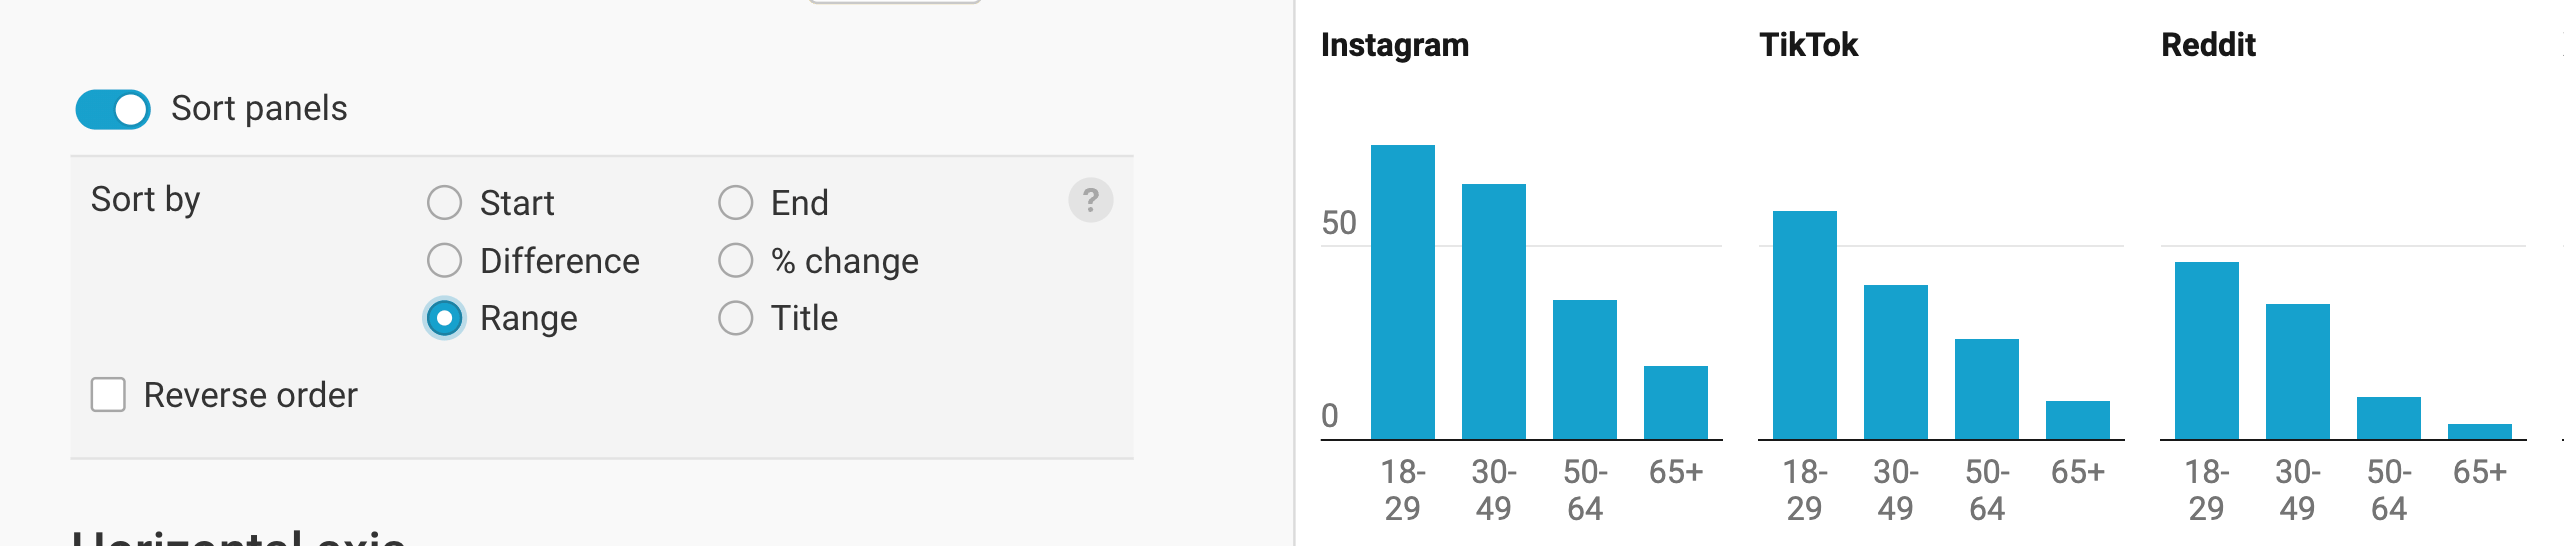
You can decide to reverse the order of the sort, to e.g. sort the panels by highest to lowest end value.
Changing the horizontal axis
This section lets you change your x-axis, including labels and grid lines.
- Select column: By default, your first column is selected – which, in most cases, will be your date/time or category column. If that's not the case, you can choose another one.
Depending on if you choose a date/time column or a category column as your first column, you'll see different options in the Horizontal axis section.
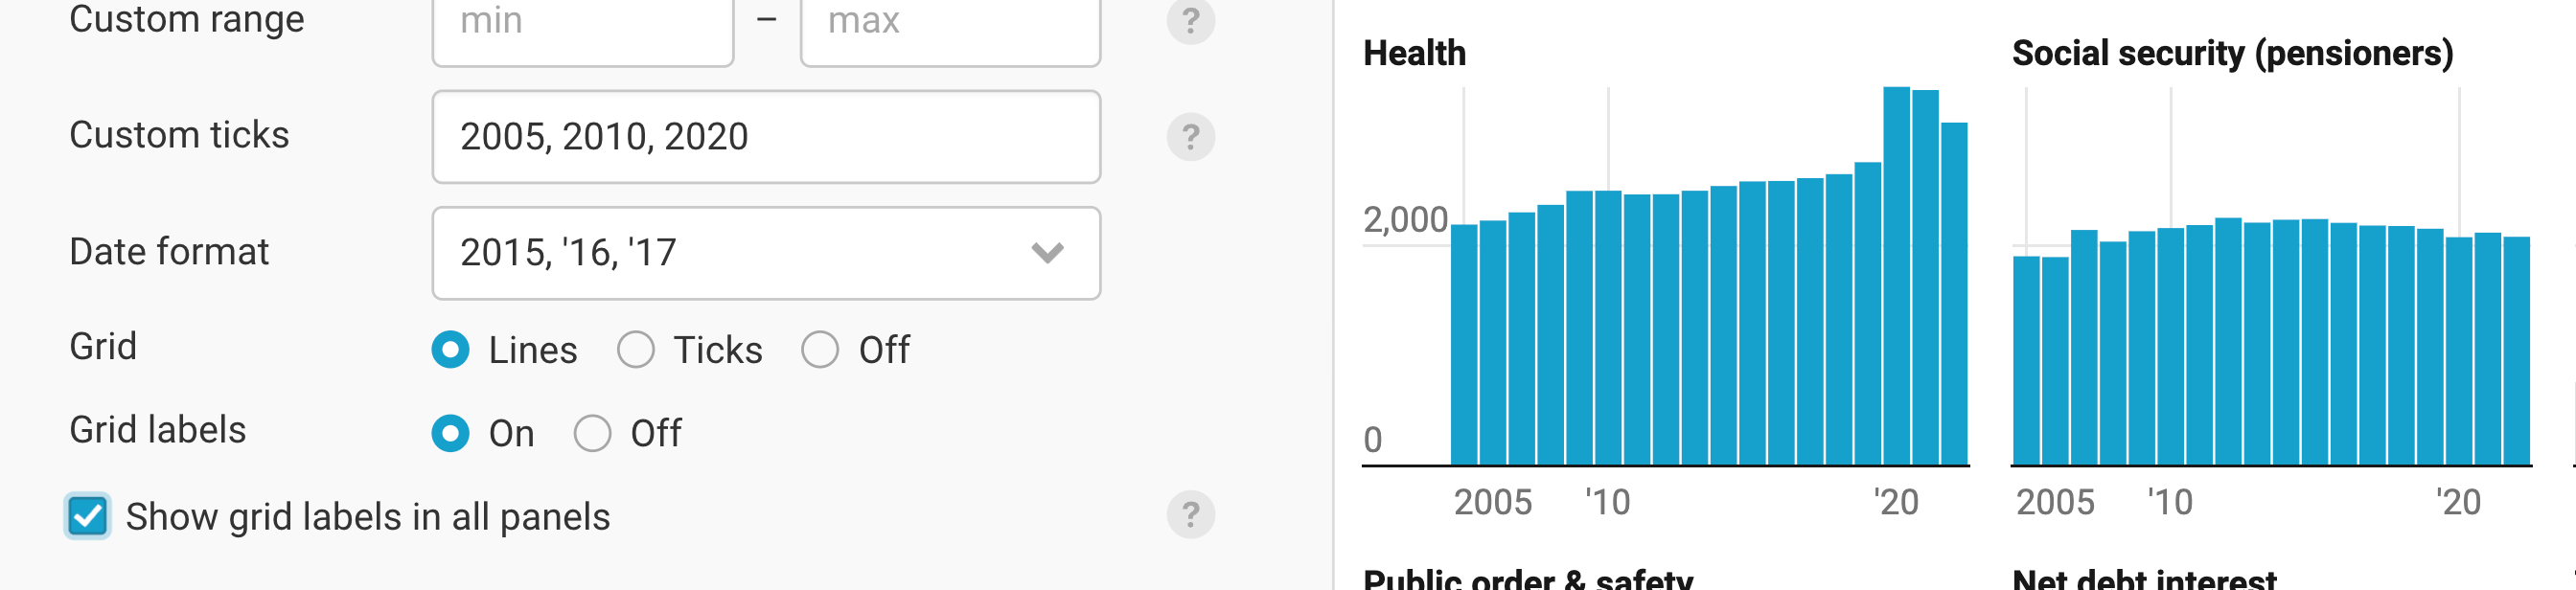
Custom range (for dates/times): By default, the horizontal axis spans from the earliest to the latest date – but you can decide to cut off data points or extend your axis here. For example, you can decide to only show data points between 2010 and 2018, even if the data goes from 2000 to 2022.
Custom ticks (for dates/times): By default, the earliest and latest date/time are labeled. If you want to label more than these two dates, you can add dates here: e.g. "2000, 2010, 2020". Note that Datawrapper makes sure that labels don't overlap, so not all labels will show up if space doesn't permit.

Tick format (for dates/times): Here you can choose how your labels should appear: Should they include months? Only show days? Learn which date formats are available for your data in this Docs article.

Grid and Grid labels: By default, no grid lines are shown, but the labels are. You can decide to show grid lines, or to only show ticks above the grid labels. You can also decide to not show the grid labels.
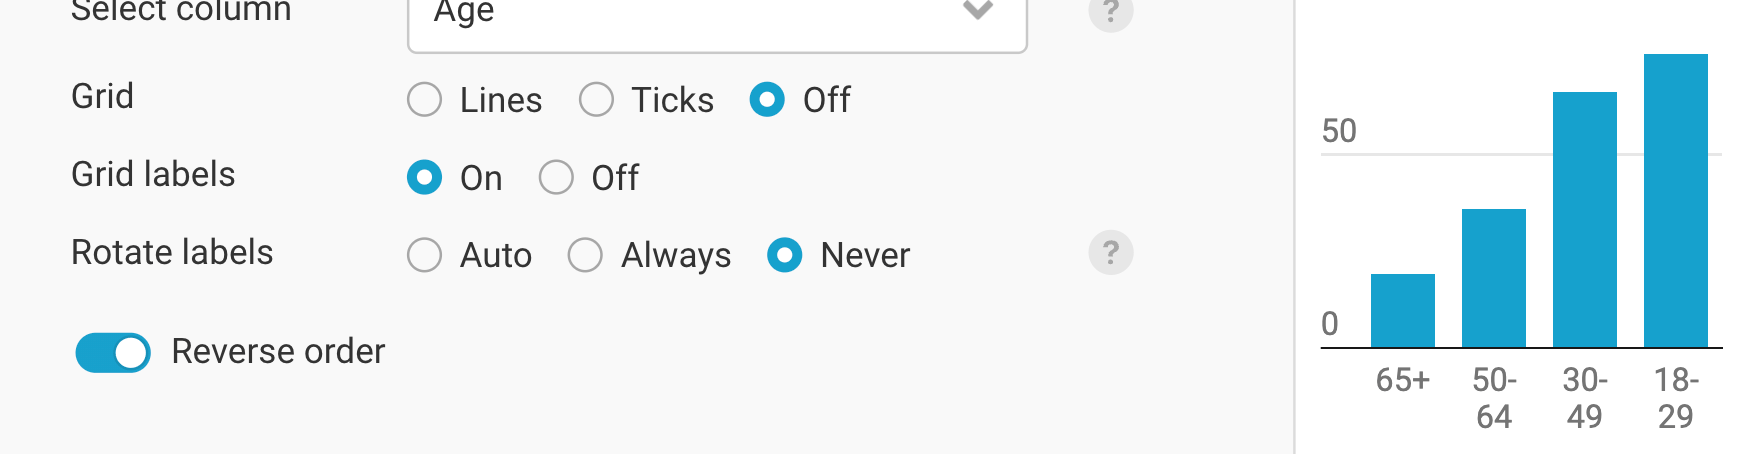
Rotate labels (for categories): By default, Datawrapper tries to always show your category labels in a nicely readable, not-rotated way. Auto makes sure they do rotate when space gets tight, e.g. on mobile.
Reverse order (for categories) reverses the order in which your categories are shown.
Show grid labels in all panels (for dates/times): By default, the grid labels (e.g. your years) are only shown in panels of the first column. You can decide to show them in all panels by turning this setting on.
Changing the vertical axis
This section lets you change your y-axis, including labels and grid lines.
Custom range: By default, the range in each panel goes from the minimum to the maximum value in your data. You can decide to extend that range from a number that's smaller than the minimum value to a range that's bigger than the maximum value. So if your data goes from 0 to 50, typing in a range from 10 to 30 won't have an effect: Datawrapper won't cut off your columns. But you can extend the range to e.g. -10 to 70. For our data, we decide to extend the range to 100(%).
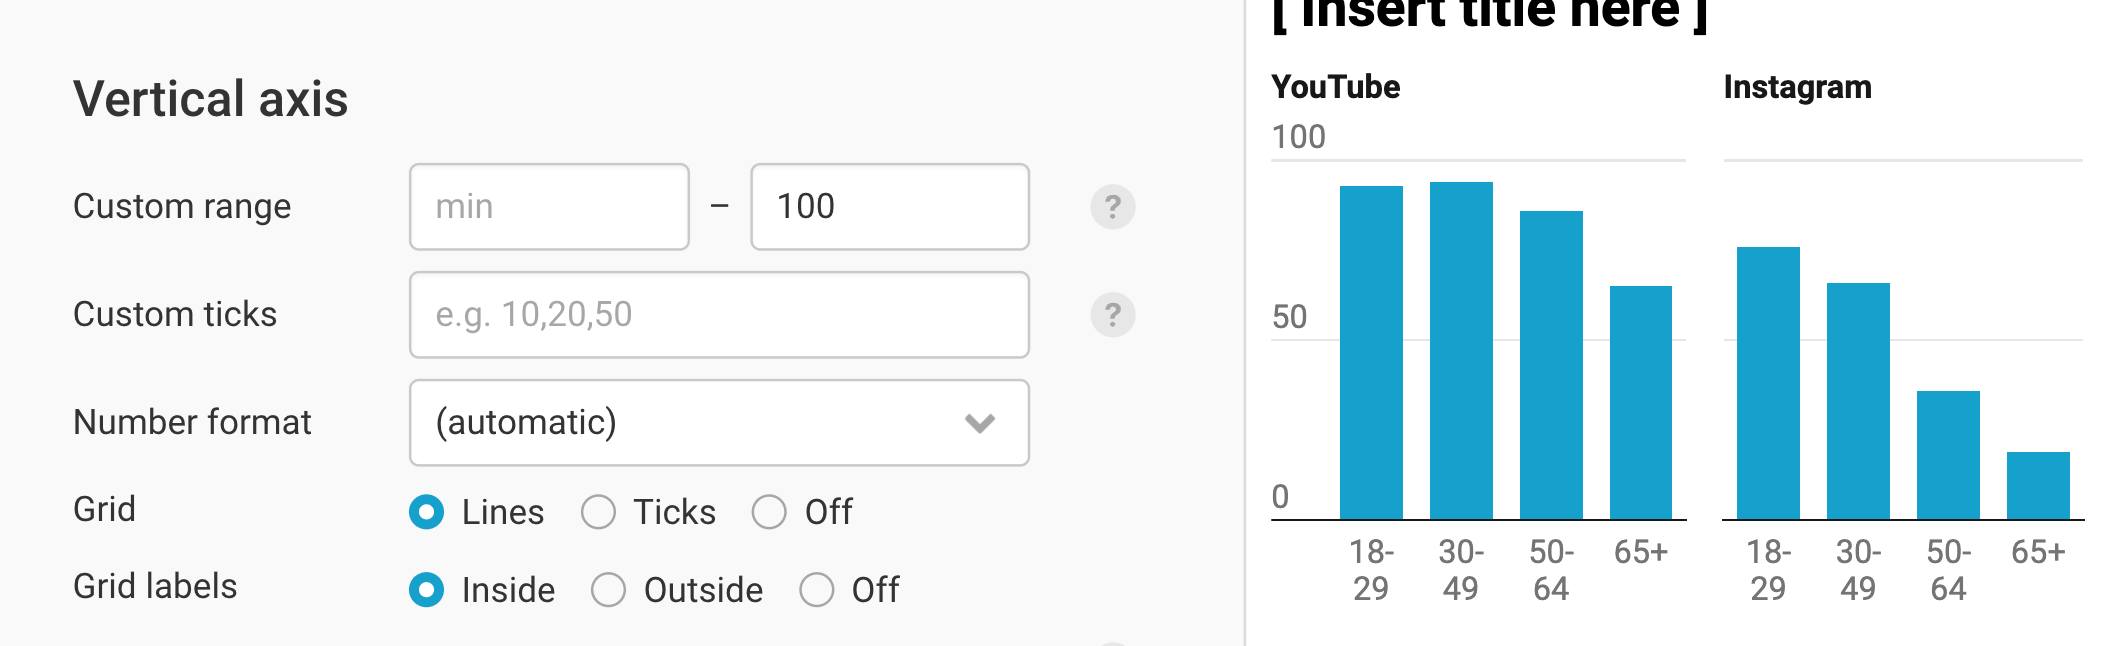
Custom ticks: By default, Datawrapper tries to find a good-looking number of grid lines it then labels. You can change that by adding your own values, separated by a comma. Note that values will only be shown if they a) don't overlap and b) are within the custom range.

Number format: Choose how your numbers should appear (e.g. 200,000 or 200K or 200,000.0%). Learn about the available options in this Docs article.
Grid: Here, too, you can decide to display the grid as lines, as ticks, or not at all (off).
Grid labels: You can decide to display your grid labels outside (= to the left, in left-to-right charts) of the panels – or inside. The latter option uses less space, but can overlap your columns. You can also choose to not display labels at all.
Show grid labels in all panels: By default, the grid labels are only shown in panels of the first column. You can decide to show them in all panels by turning this setting on. Note that this makes your panels narrower, which means your category labels might also shrink:
Use independent scales for each panel means that in each panel, the range will reflect the range of the data for that panel (instead of the range of all uploaded data). Meaning, the tallest column in each panel is always as tall as the panel.
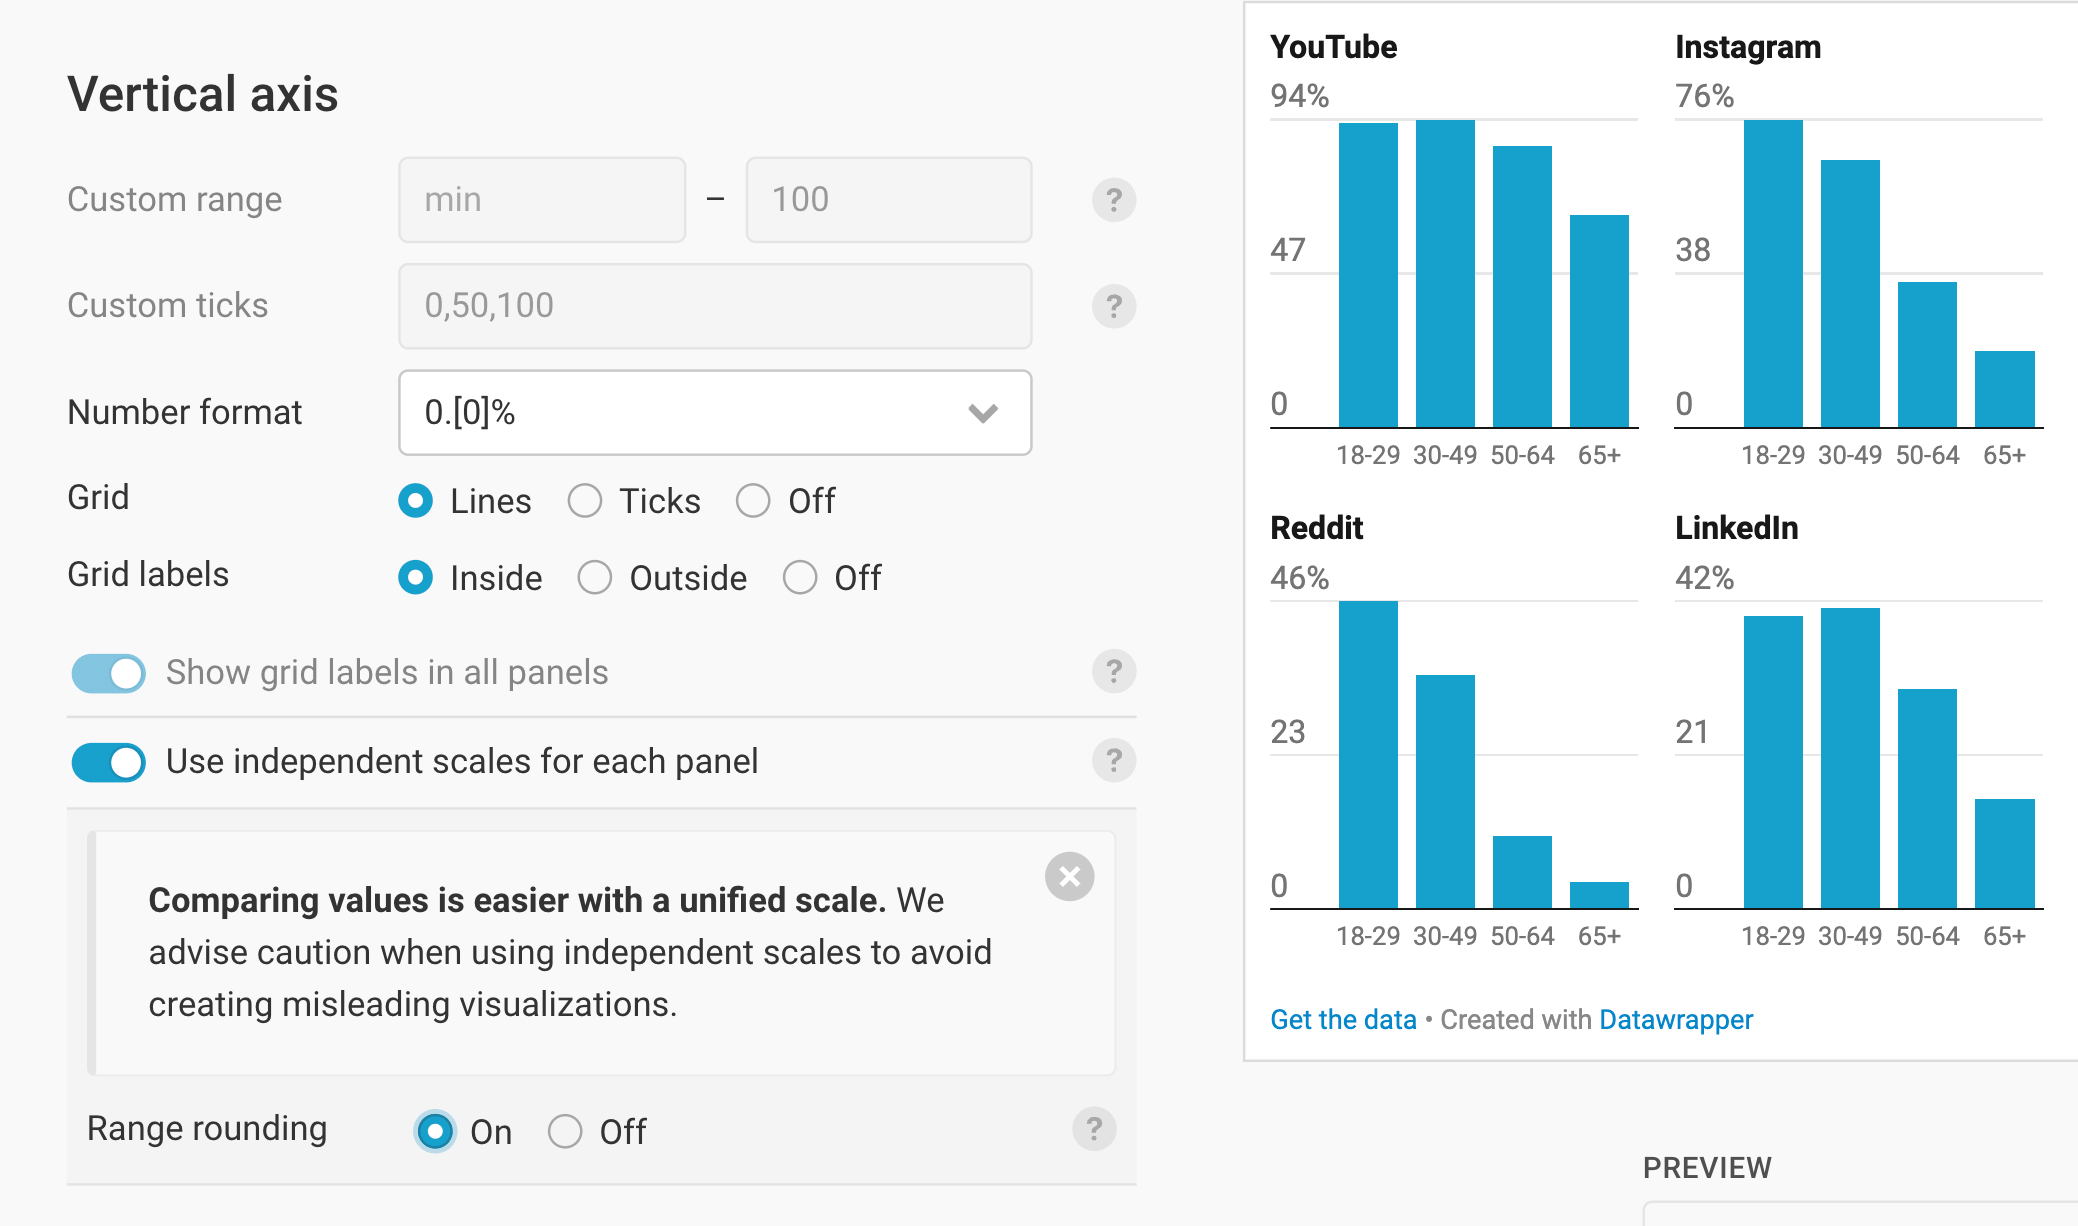
That has some consequences: You can't change the custom range or custom ticks anymore, and grid labels are always shown in all panels. You do get the option to round the scale of all panels with Range rounding, so that grid lines or ticks are aligned in all panels.
Styling the columns
This section lets you style your columns (color and how far they're apart from each other) and where they show up:

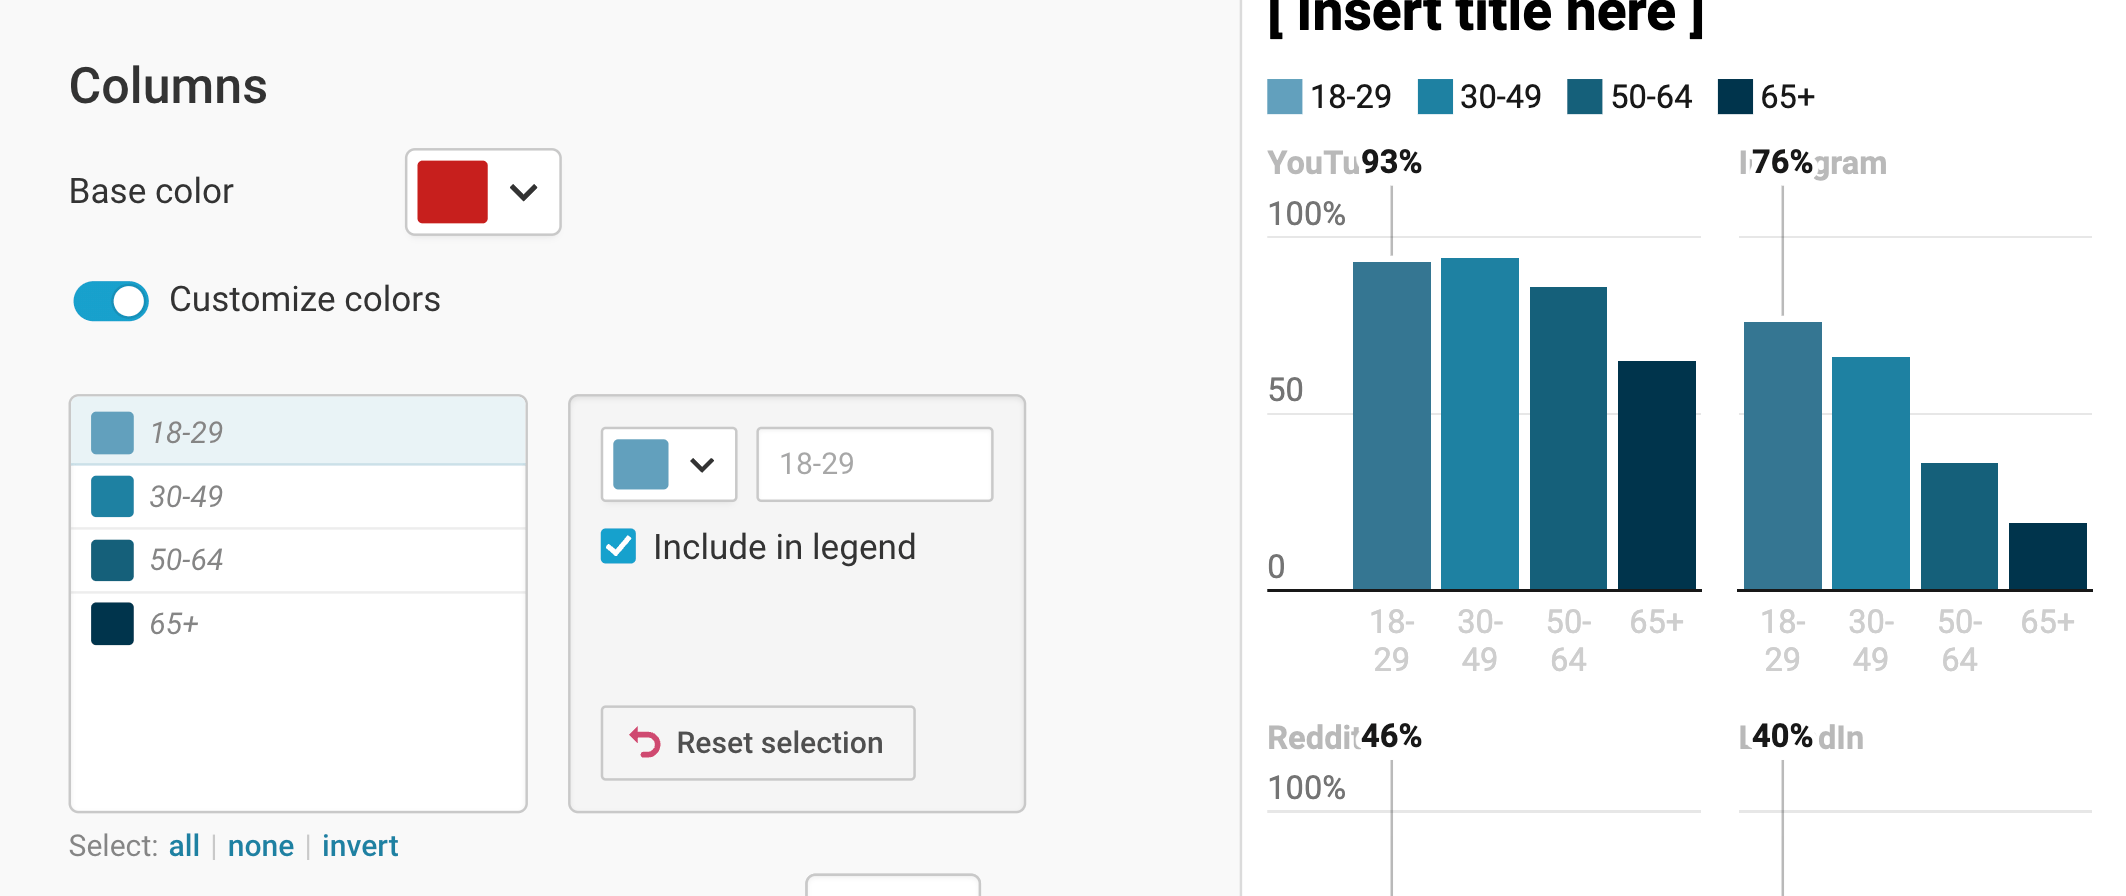
You can change the color of all columns, of all columns in the same category (e.g. "18-29"), or of all columns in a panel (e.g. "YouTube"):
Base color changes the color of all columns. If you customize the colors of any columns or panels individually, only the not-yet-customized colors will change with this setting.
Customize colors changes the colors of all columns in the same category (e.g. "18-29"). If you change a column color, it'll automatically show up in a color legend at the top:
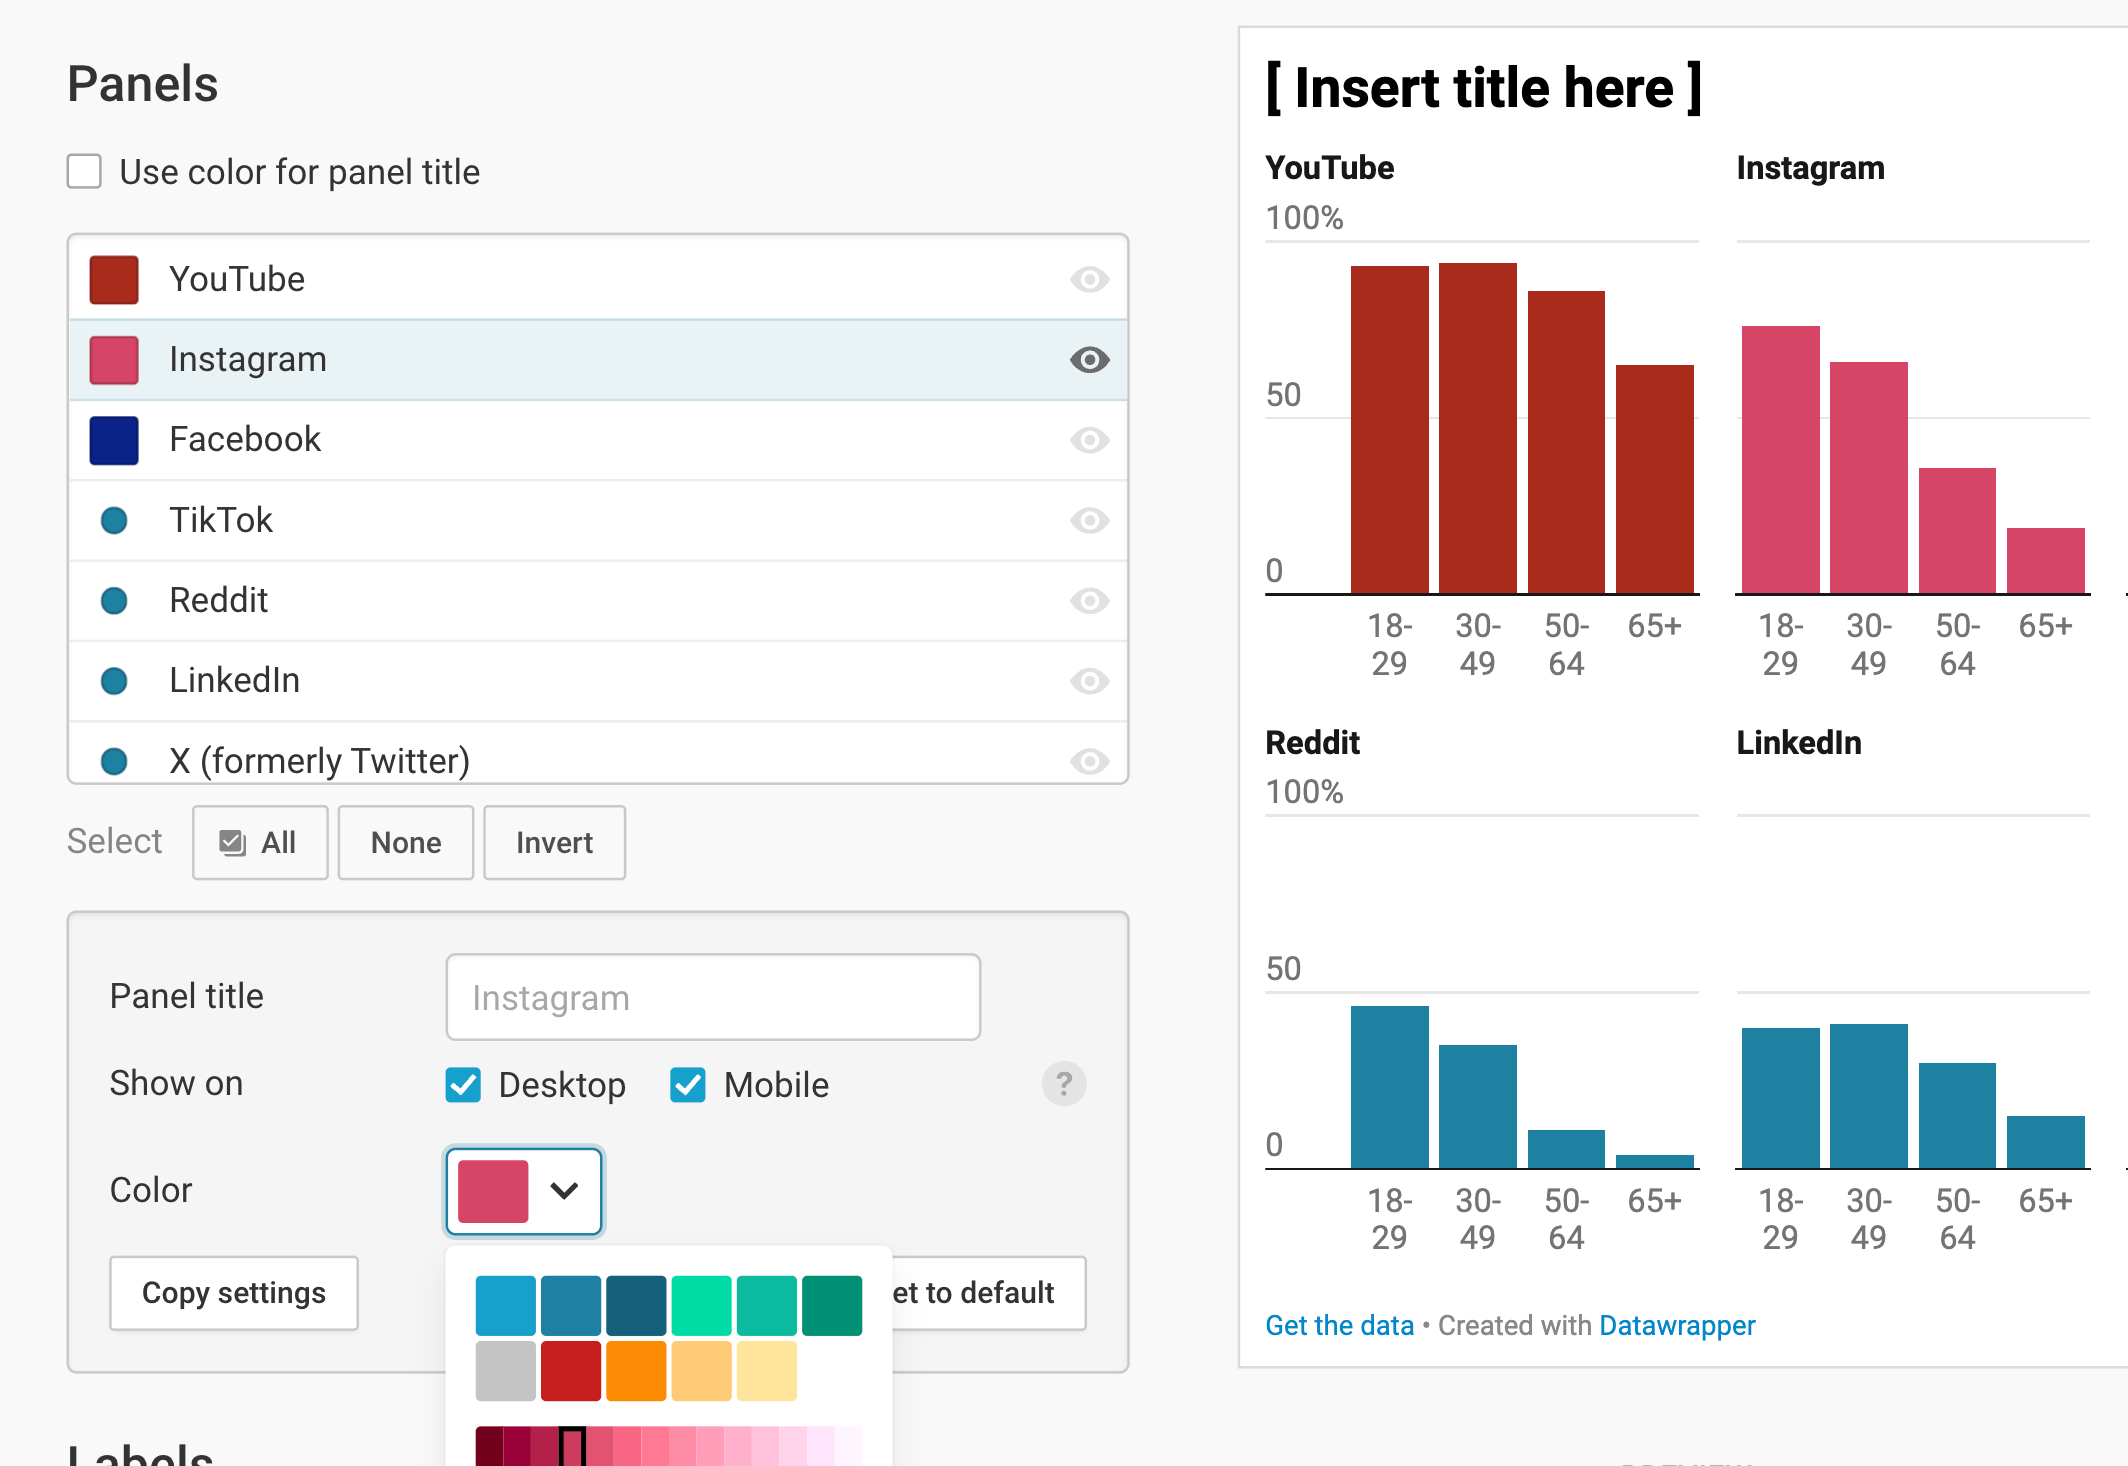
To change the colors of all columns in certain panels, scroll down to the Panels section, select one or multiple panels in the list there (you can hold Shift or Ctrl/Command to select multiple), then pick a color:
In the Columns section, you'll also get the option to set the Space between the columns. Depending on your data, more or less space might work better. We set the space to a low percentage because of our wide category labels:
Customizing the panels
Besides changing the colors of panels (see above), you have a few more options in the Panels section:
Use color for panel titles does exactly that: The column color (or a slightly darker option if the light color is too light) gets used for the title above the panel.
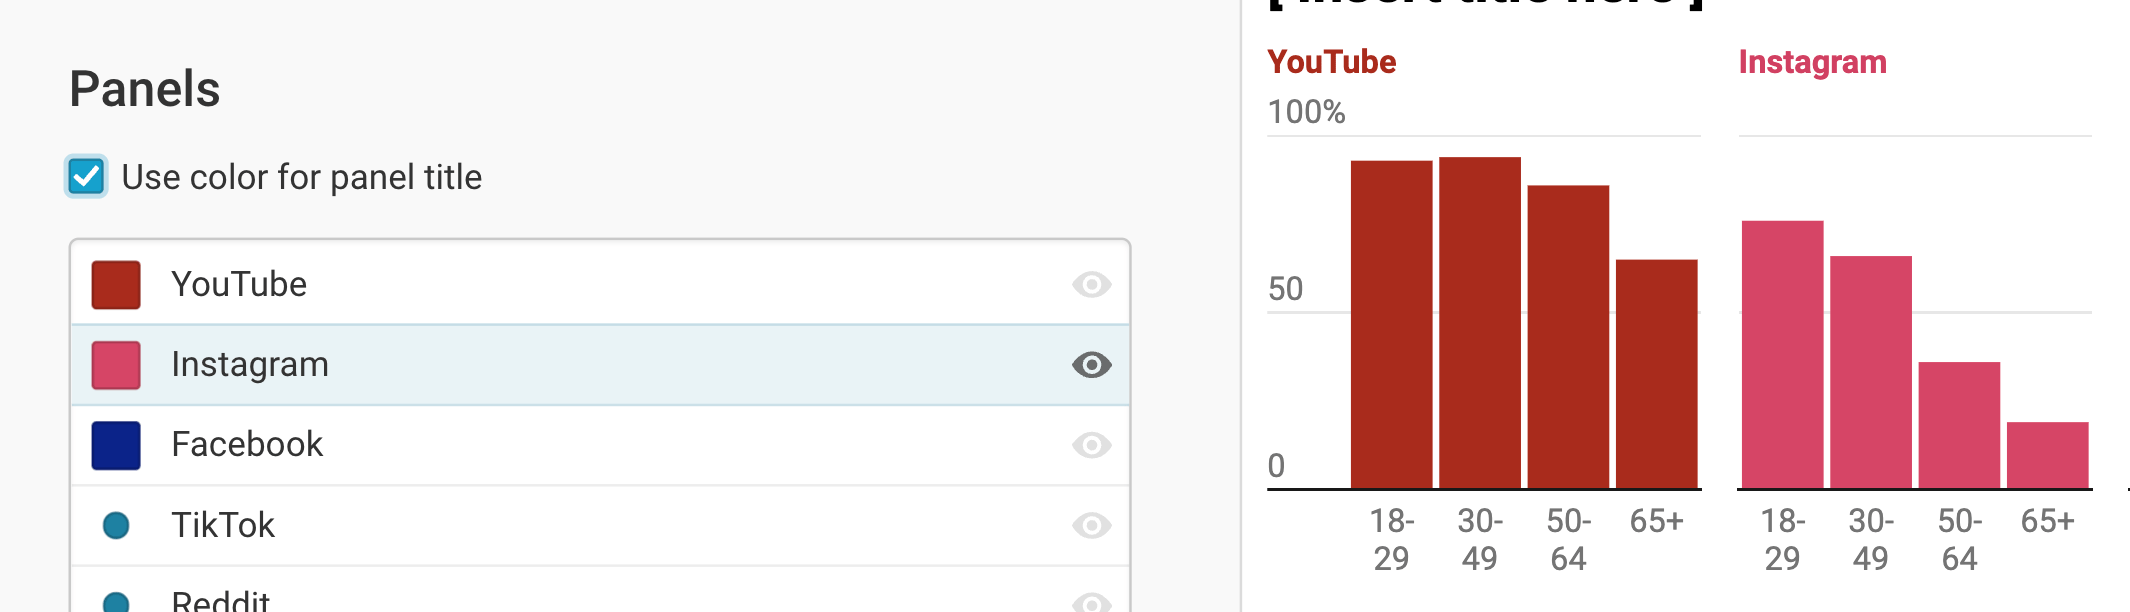
If you select a panel in the list, you can also change the following:
- Panel title lets you change the name of your panel.
- Show on lets you choose if your panels should appear on both wider screens ("desktop", >500px), narrow screens ("mobile"), only one of them, or neither. Depending on what you choose, you'll see a symbol in the panel list itself. You can also click on the eye in the panel list to hide certain panels.
At the end of the settings for each panel, you'll find the options to copy and paste settings. Click copy settings, then select at least one other panel in the list and click on paste settings to give your newly selected panels the same settings:
You can customize panels further after pasting a setting. If you're not happy with the result, you can always click on Reset to default.
Showing value labels
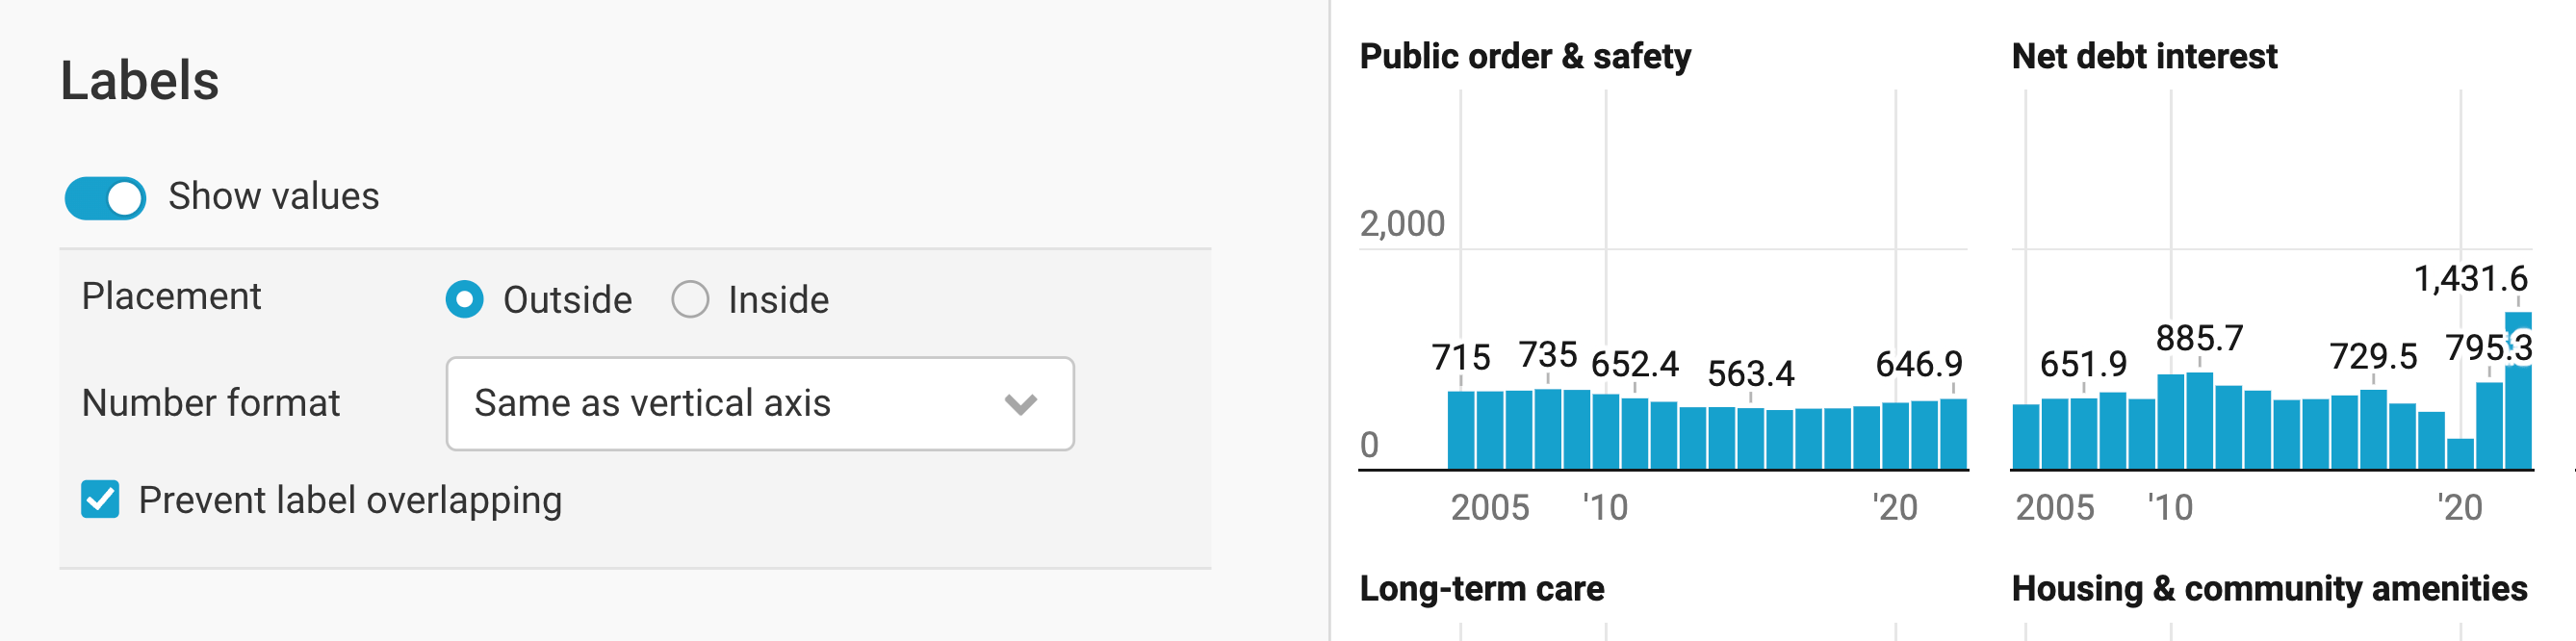
You can decide to show values for your columns:

Placement lets you choose between displaying labels outside (= above and below) the columns, or inside of them. If a column is too small to show the label inside, it'll move outside automatically.
Number format lets you choose another number format than the vertical axis. For our chart, we're happy with the %-signs, so we're keeping that number format.
Prevent label overlapping is turned on by default and does exactly that: In cases with lots of columns, Datawrapper only labels a few columns.
Adding overlays
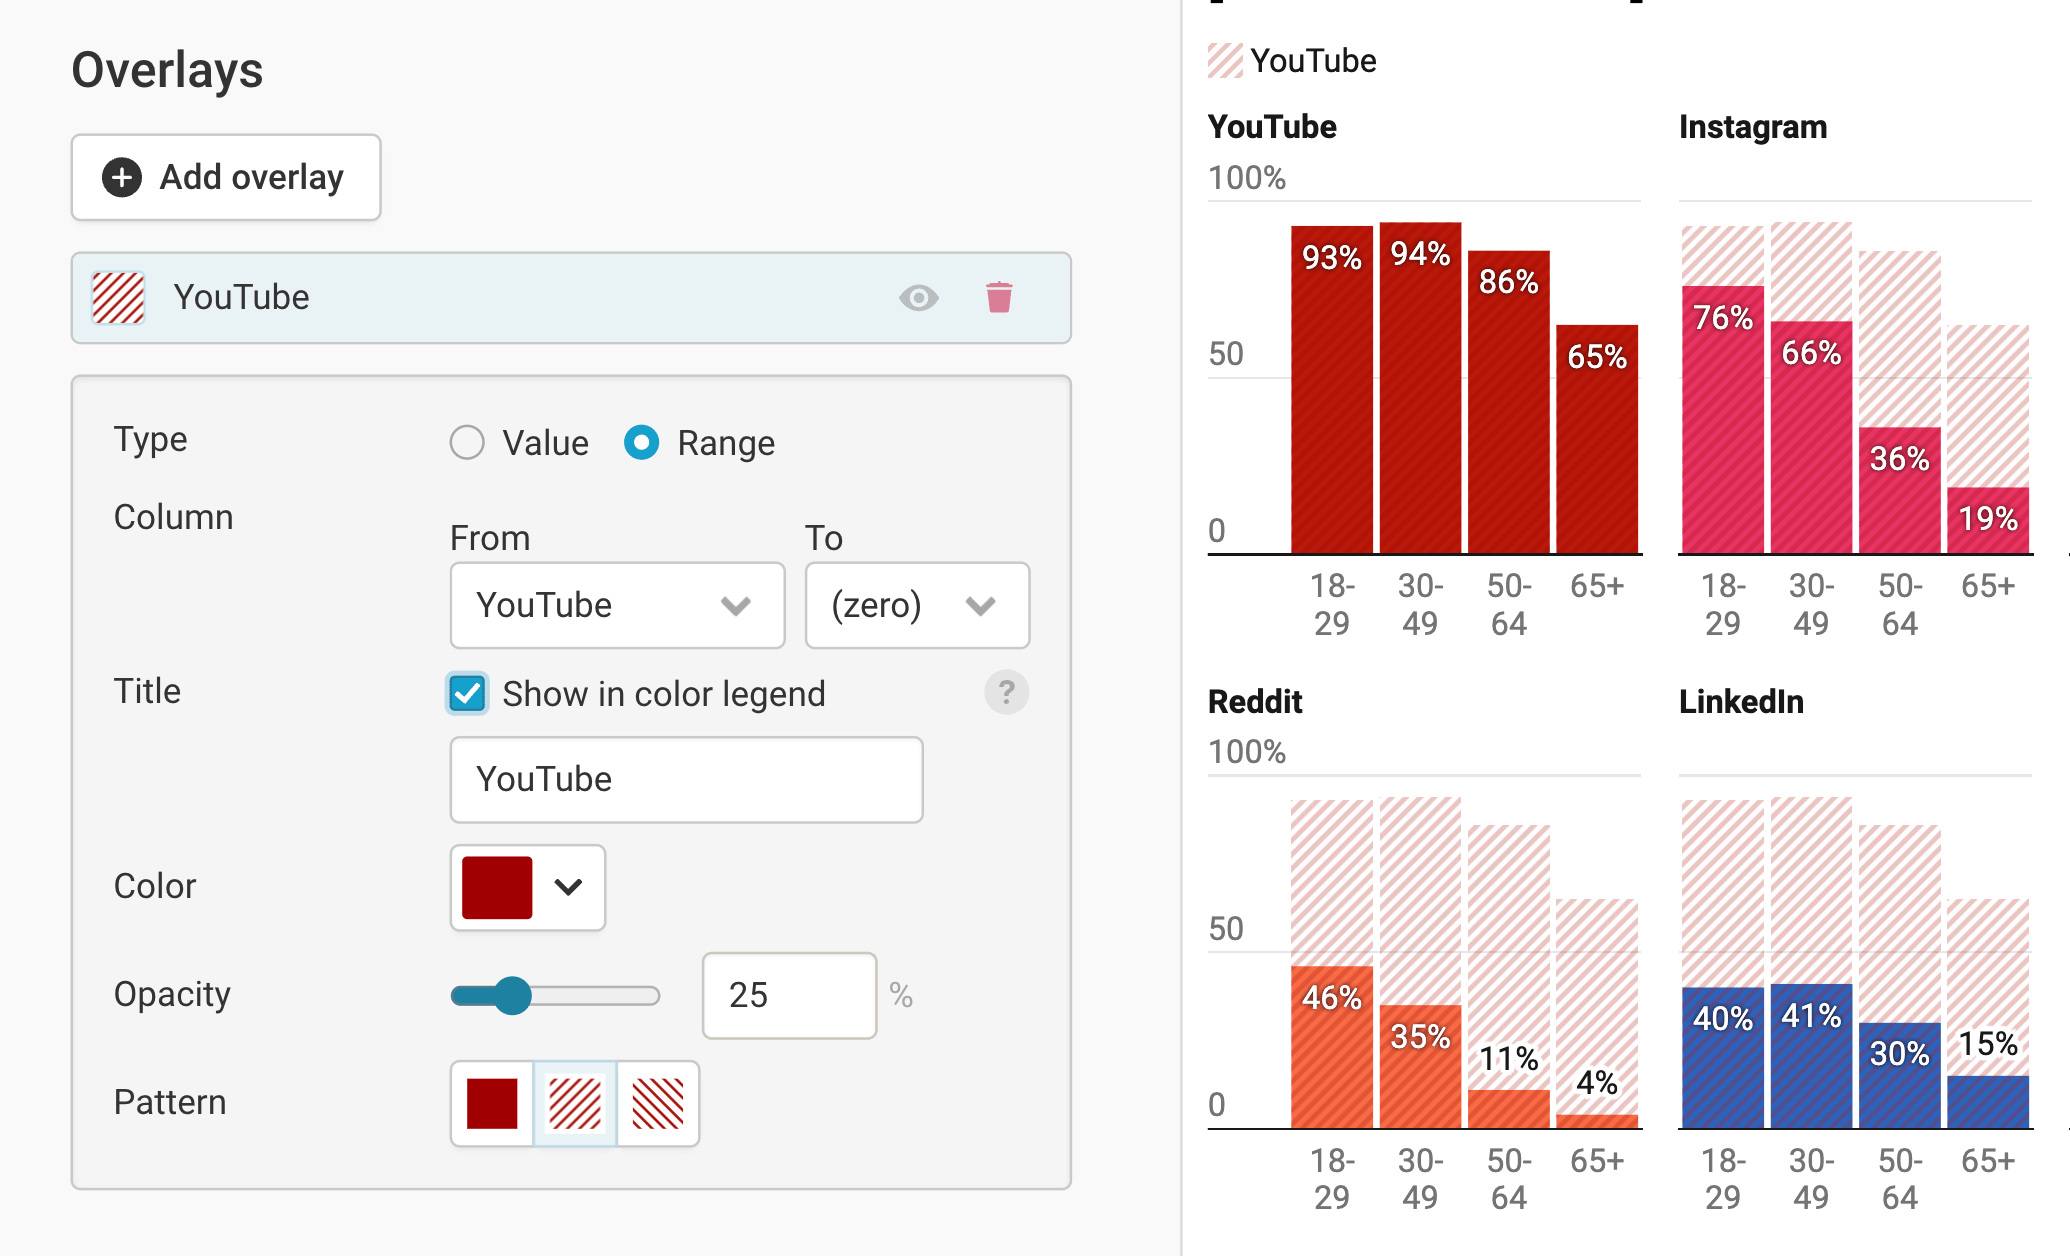
For better comparisons across panels or if you simply want to provide some context data, you can add overlays. These are markers or ranges on top of your panels. To add one, click on Add overlay. You can then decide if you want to set a value marker, or highlight a whole range:

If you set a value marker, you can choose the column with the values you want to display in all panels. (This can also be a hidden panel!) By default, it gets show in the color legend with a title you can choose – but you can turn that off. Finally, you can choose the color and opacity of the marker, to decide how prominent it should be in your chart.
If you want to add a range overlay, you need to pick two columns: The start and the end point of the range. Here too, you can decide to display it in the color legend or not, and pick a color and opacity. In addition, you can set a pattern to make it more visible on colorful columns.
Changing the tooltips
By default, tooltips are turned on and synced in all panels. That means that if you hover over a column in one panel, tooltips will also appear in every other panel for the same date/time. You can turn that off by deselecting Sync tooltips in all panels synchronously. You can also decide to give your tooltip a different date format and number format:
After working through all these options in the Refine tab, let's move on to the next tab: Annotate.
Annotating your chart
In the Annotate tab, you have the option to add text and highlight elements, ranges, and lines to your small multiple column chart:=.
Adding a title and source

You can learn more about adding a title, description, notes, etc. to your chart in our Docs article Annotating your visualization in the "Annotate" tab.
Highlighting columns
You can highlight specific columns in one or all panels by clicking on Add highlight and then clicking on a column you want to highlight. If you do so, you'll see the option to...
- Choose a panel in which you want the highlight to show up, or repeat the highlight in all panels.
- Show column's value in case you don't have value labels enabled anyway. (In our chart, that's the case, so we don't get the option to show the column's value.)
Here's an in-depth explanation of all the options.
Adding text annotations
Text annotations are great to give context to your chart or point out certain data points. You'll find that adding annotations in multiple column charts works just like in any other Datawrapper chart – here's our Docs article on creating text annotations – with three exceptions:
- You can decide with a dropdown which panel your annotation should be in. (That's great for duplicating annotations!)
- You can drag an annotation from one panel to the next.
- You can decide to repeat an annotation in all panels.
Highlighting ranges
If you want to point out a date or value range/line or a few columns, click on Add range highlight. You can then drag a range directly in one of your panels, move it around, or change the position in the settings of the highlight.
Depending on which direction you drag in (or what you choose in the Orientation setting), you can add vertical or horizontal ranges/lines.
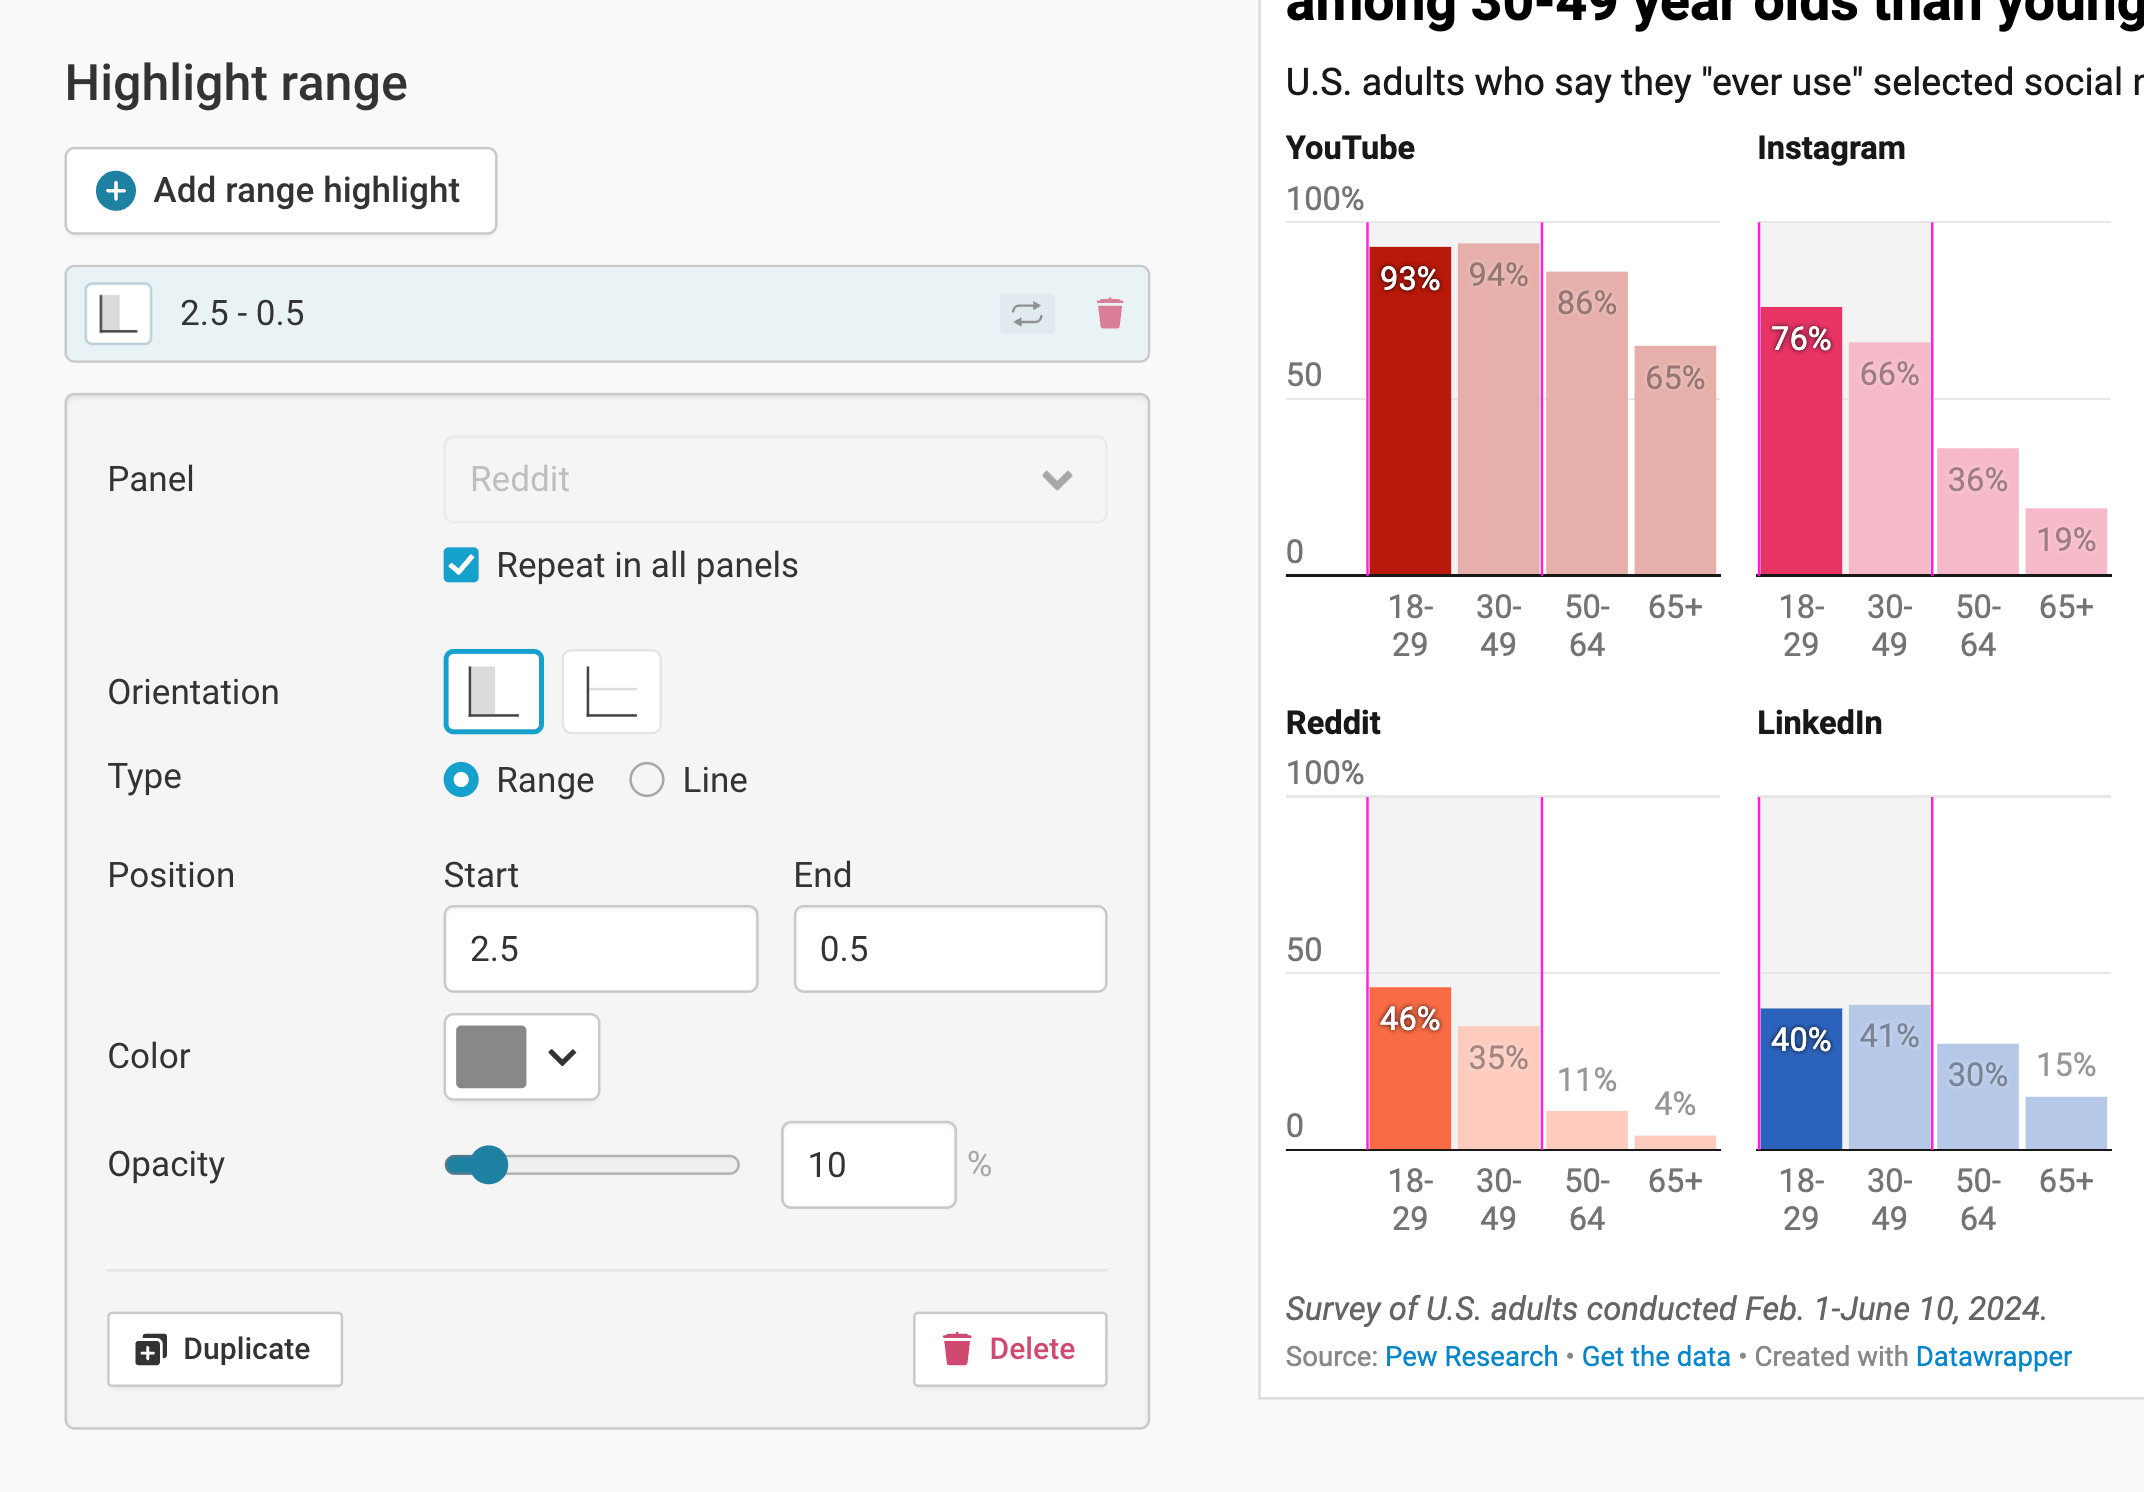
As you can see, here too you can select the panel in which you want the range highlight to show up, or repeat it in all panels. You can also change the color and opacity of your highlight range.
Publishing your chart
After adding text to our chart, only one tab is left in step 3: Visualize: the Layout tab. You can find all Layout settings explained in this Docs article.
In step 4: Publish & Embed, you can first publish your chart and then decide how it gets to your readers. We recommend pasting the embed code into your website or CMS, but you can also share the chart's URL. Learn more about both options here. To use your chart somewhere else, download it as a PNG (on any plan) or as an SVG or PDF (on paid plans). See what each plan includes on our pricing page.
And that's it! You've successfully created and customized a small multiple column chart.