How to create a GIF of your chart/map
- Free
- Pro
- Business
- Enterprise
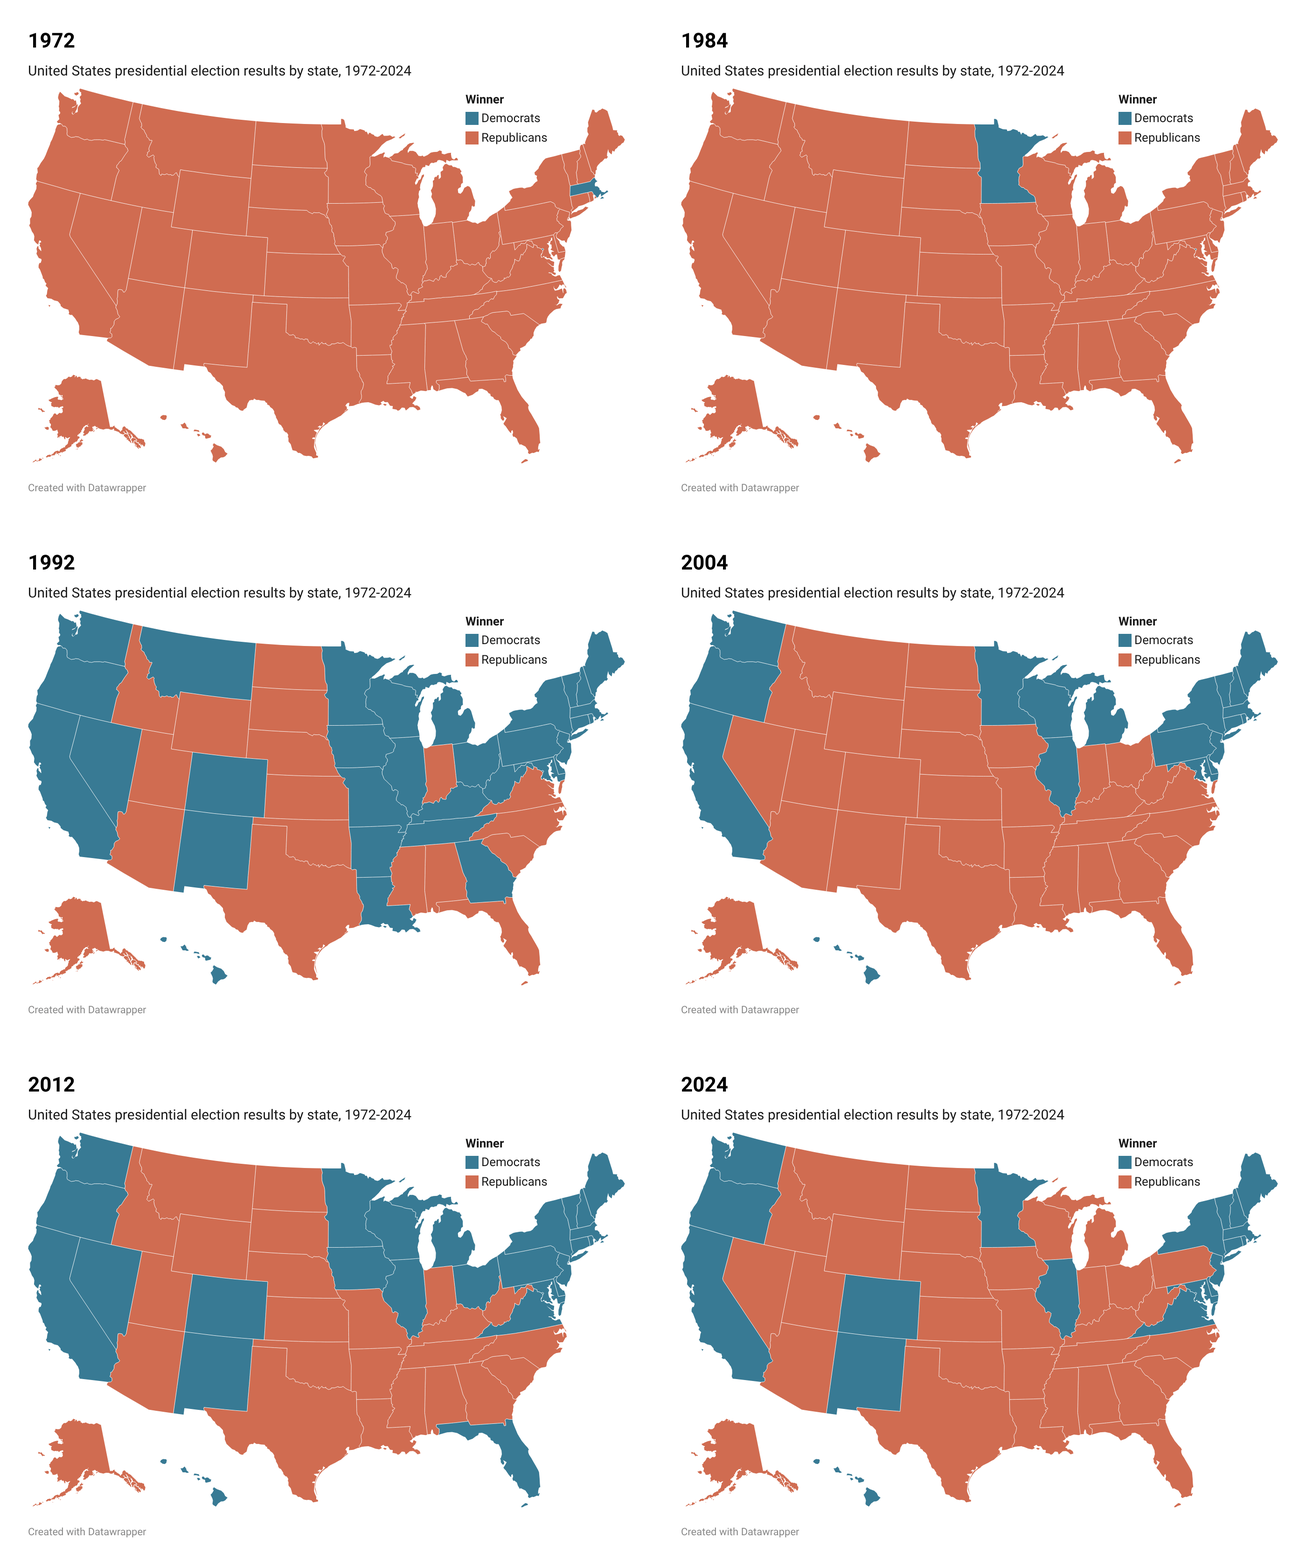
Datawrapper does not offer an out-of-the-box solution to create a timelapse of your visualizations. However, there is a workaround to put together your own animated GIF by stitching together multiple Datawrapper visualizations.
How to create a time-lapse of maps
Even though there is no out-of-the-box solution to create an animated GIF with Datawrapper maps, you can create multiple maps with different time-stamps and stitch them together into a GIF using a free online tool like the ezgif.com Animated GIF Maker. Here's how:
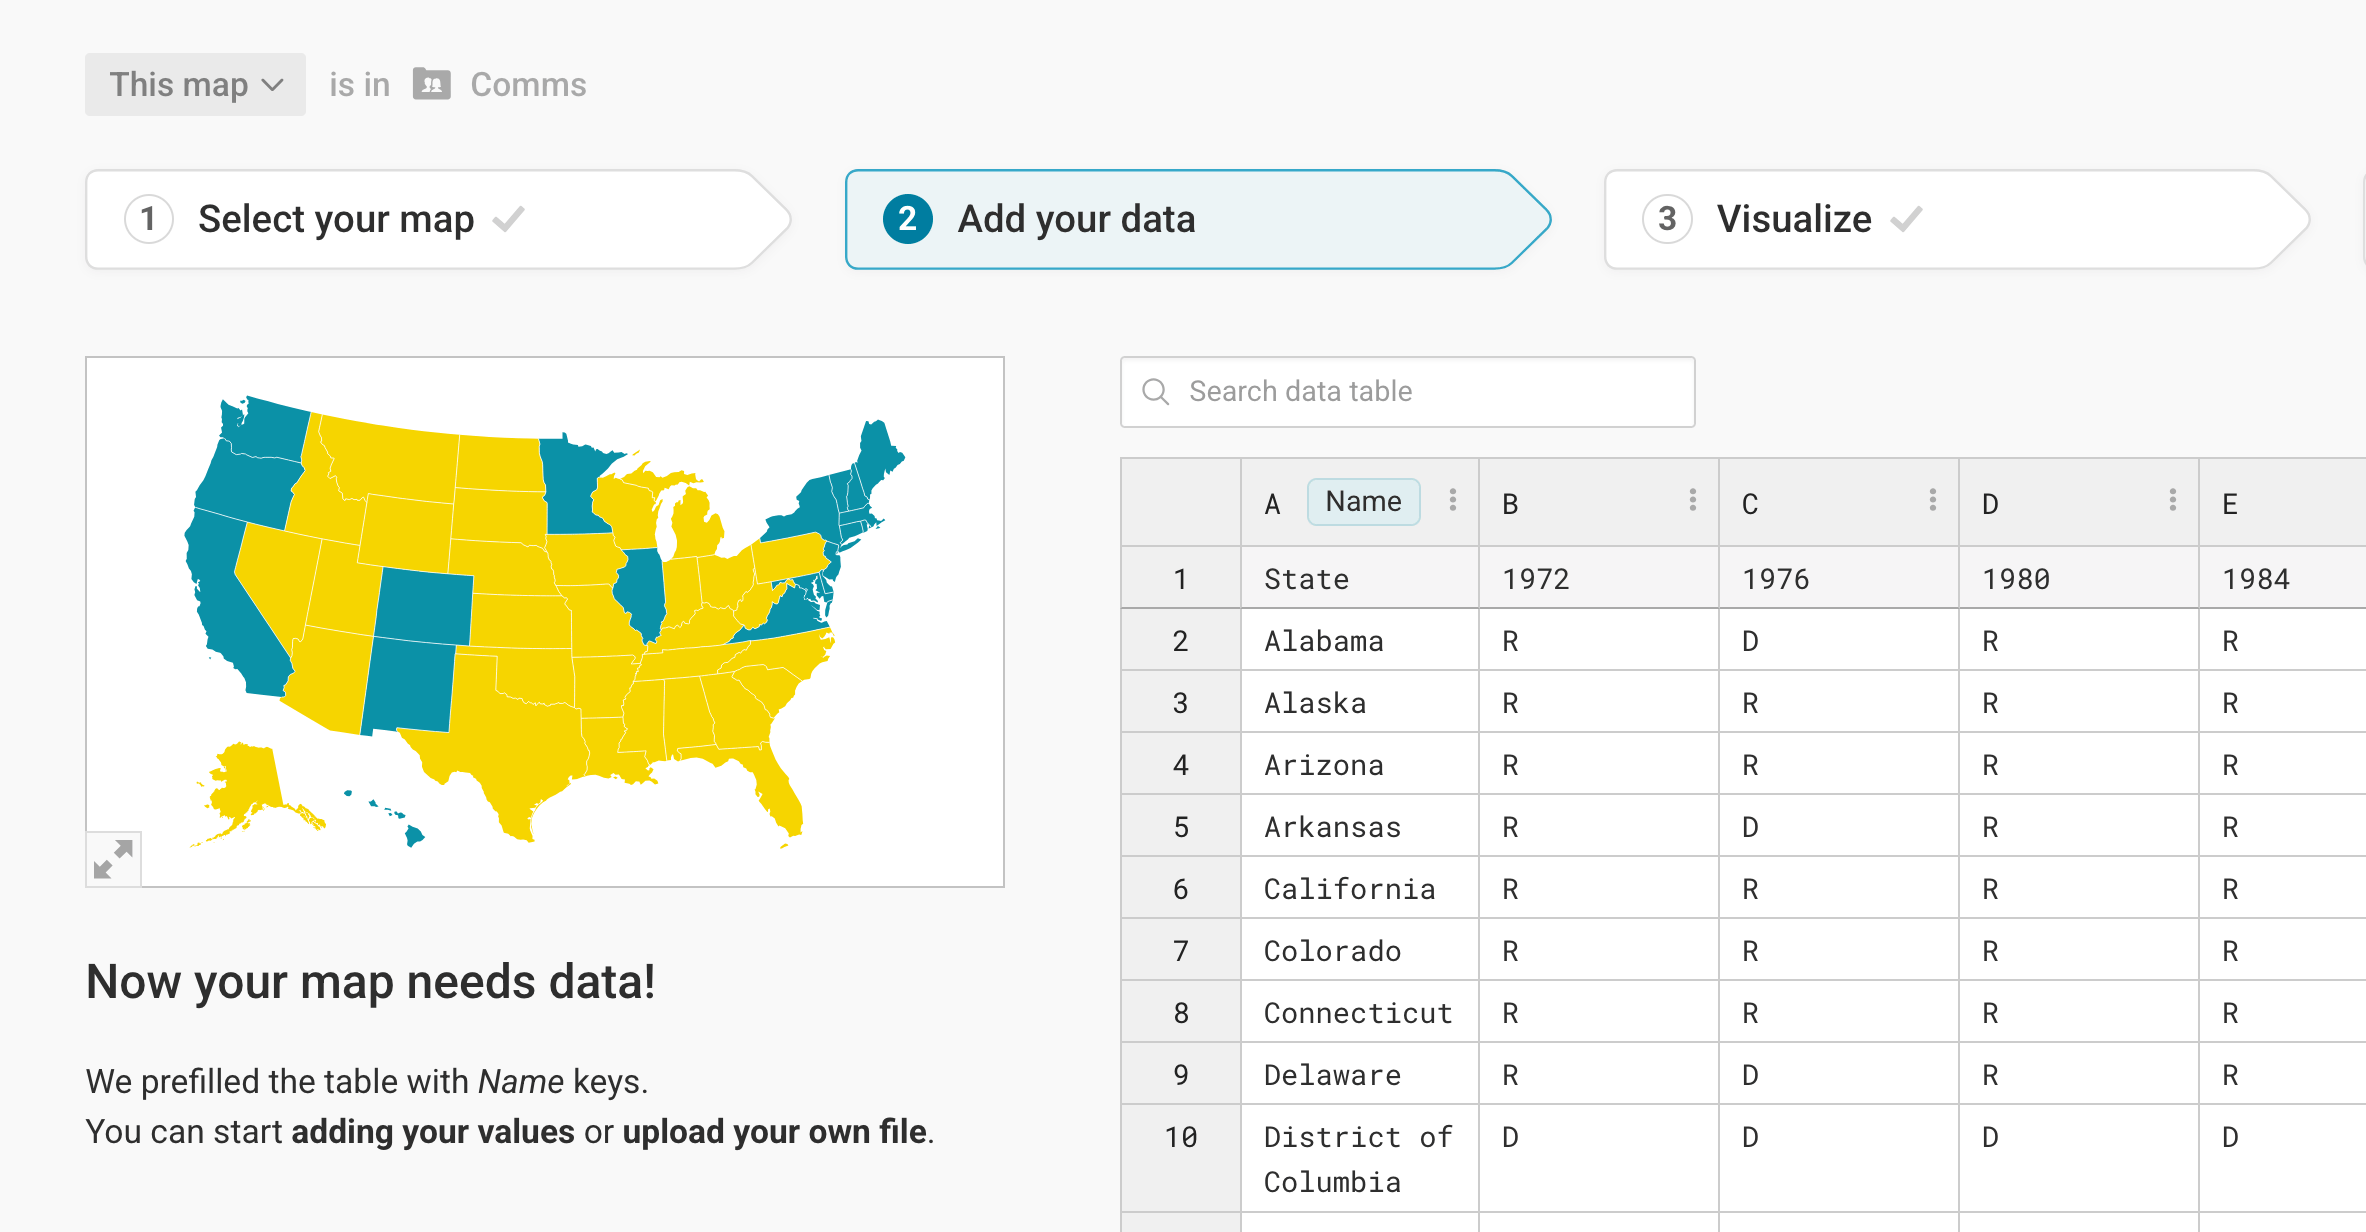
To not having to create a new visualization for each of your GIF frames, upload all the columns you want to show together. For the GIF of historical US election results, that means uploading one state column, and then one column for each year with the election results:
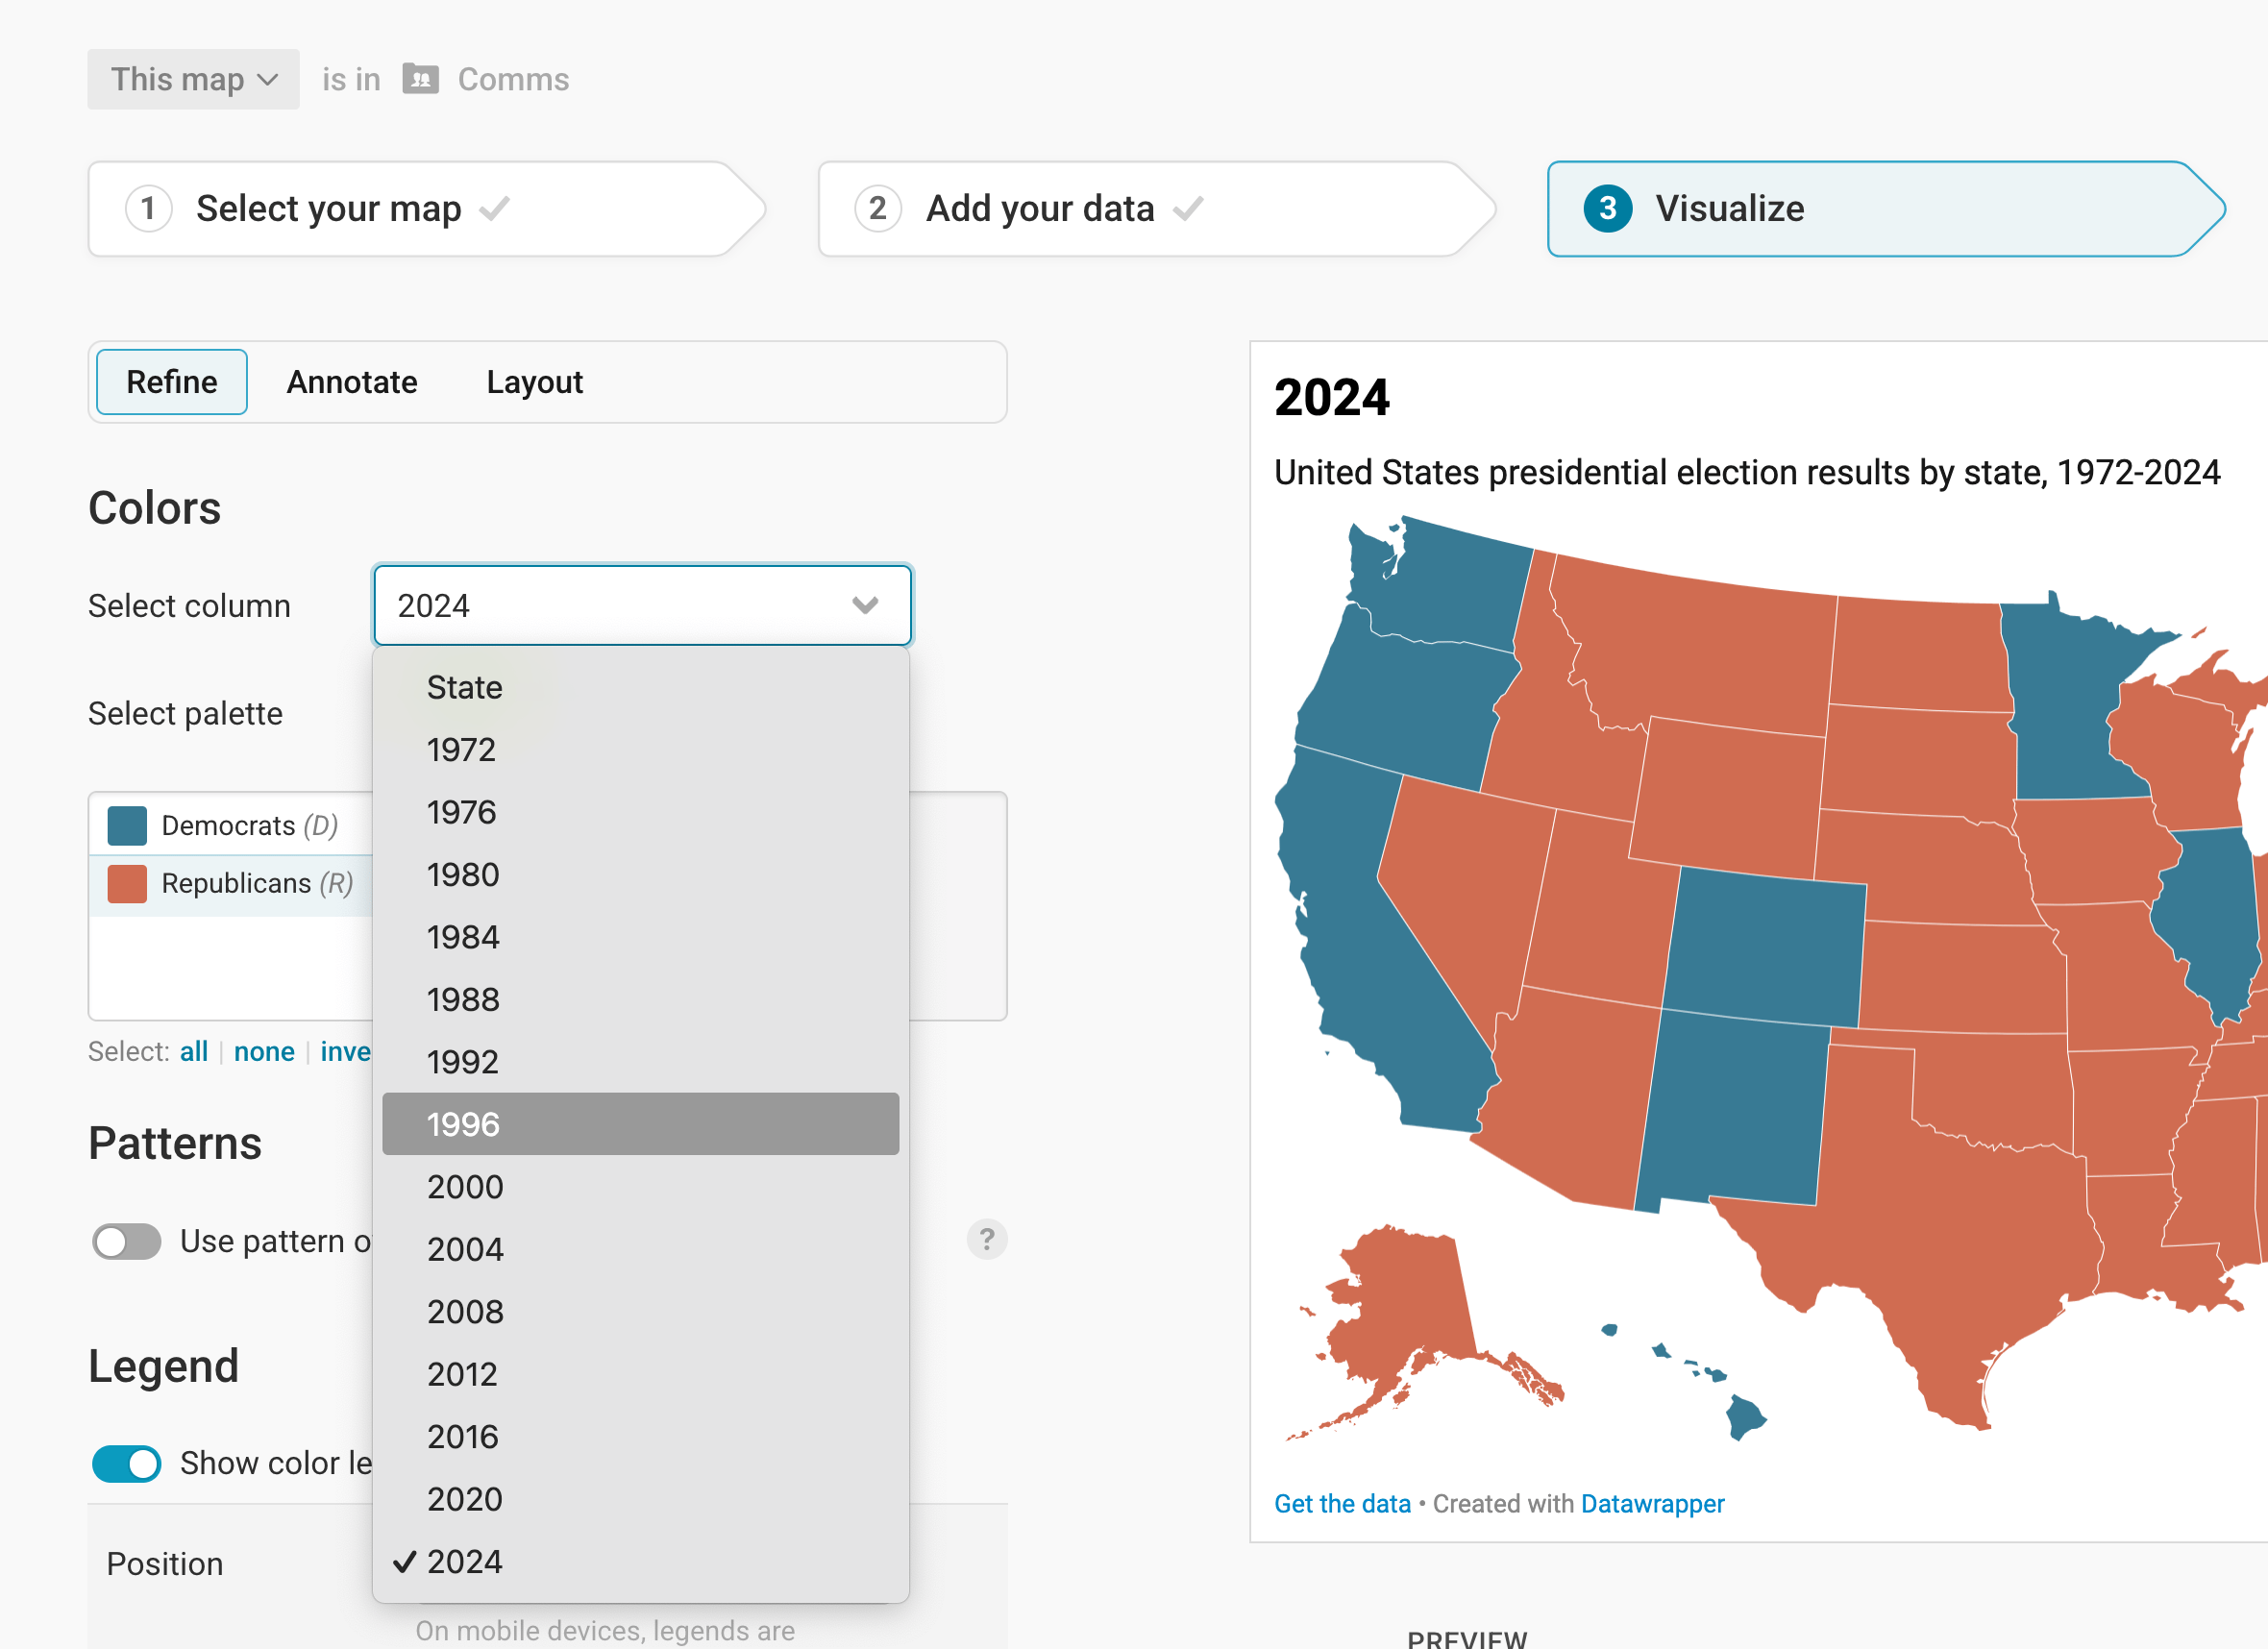
Now all your columns will show up when you go to step 3: Visualize > Refine > Colors and click on Select column. Now you can easily create each frame for your GIF. First, choose a column:
Then change the title or description (optional), and go to step 4: Publish and download your visualization as PNG:
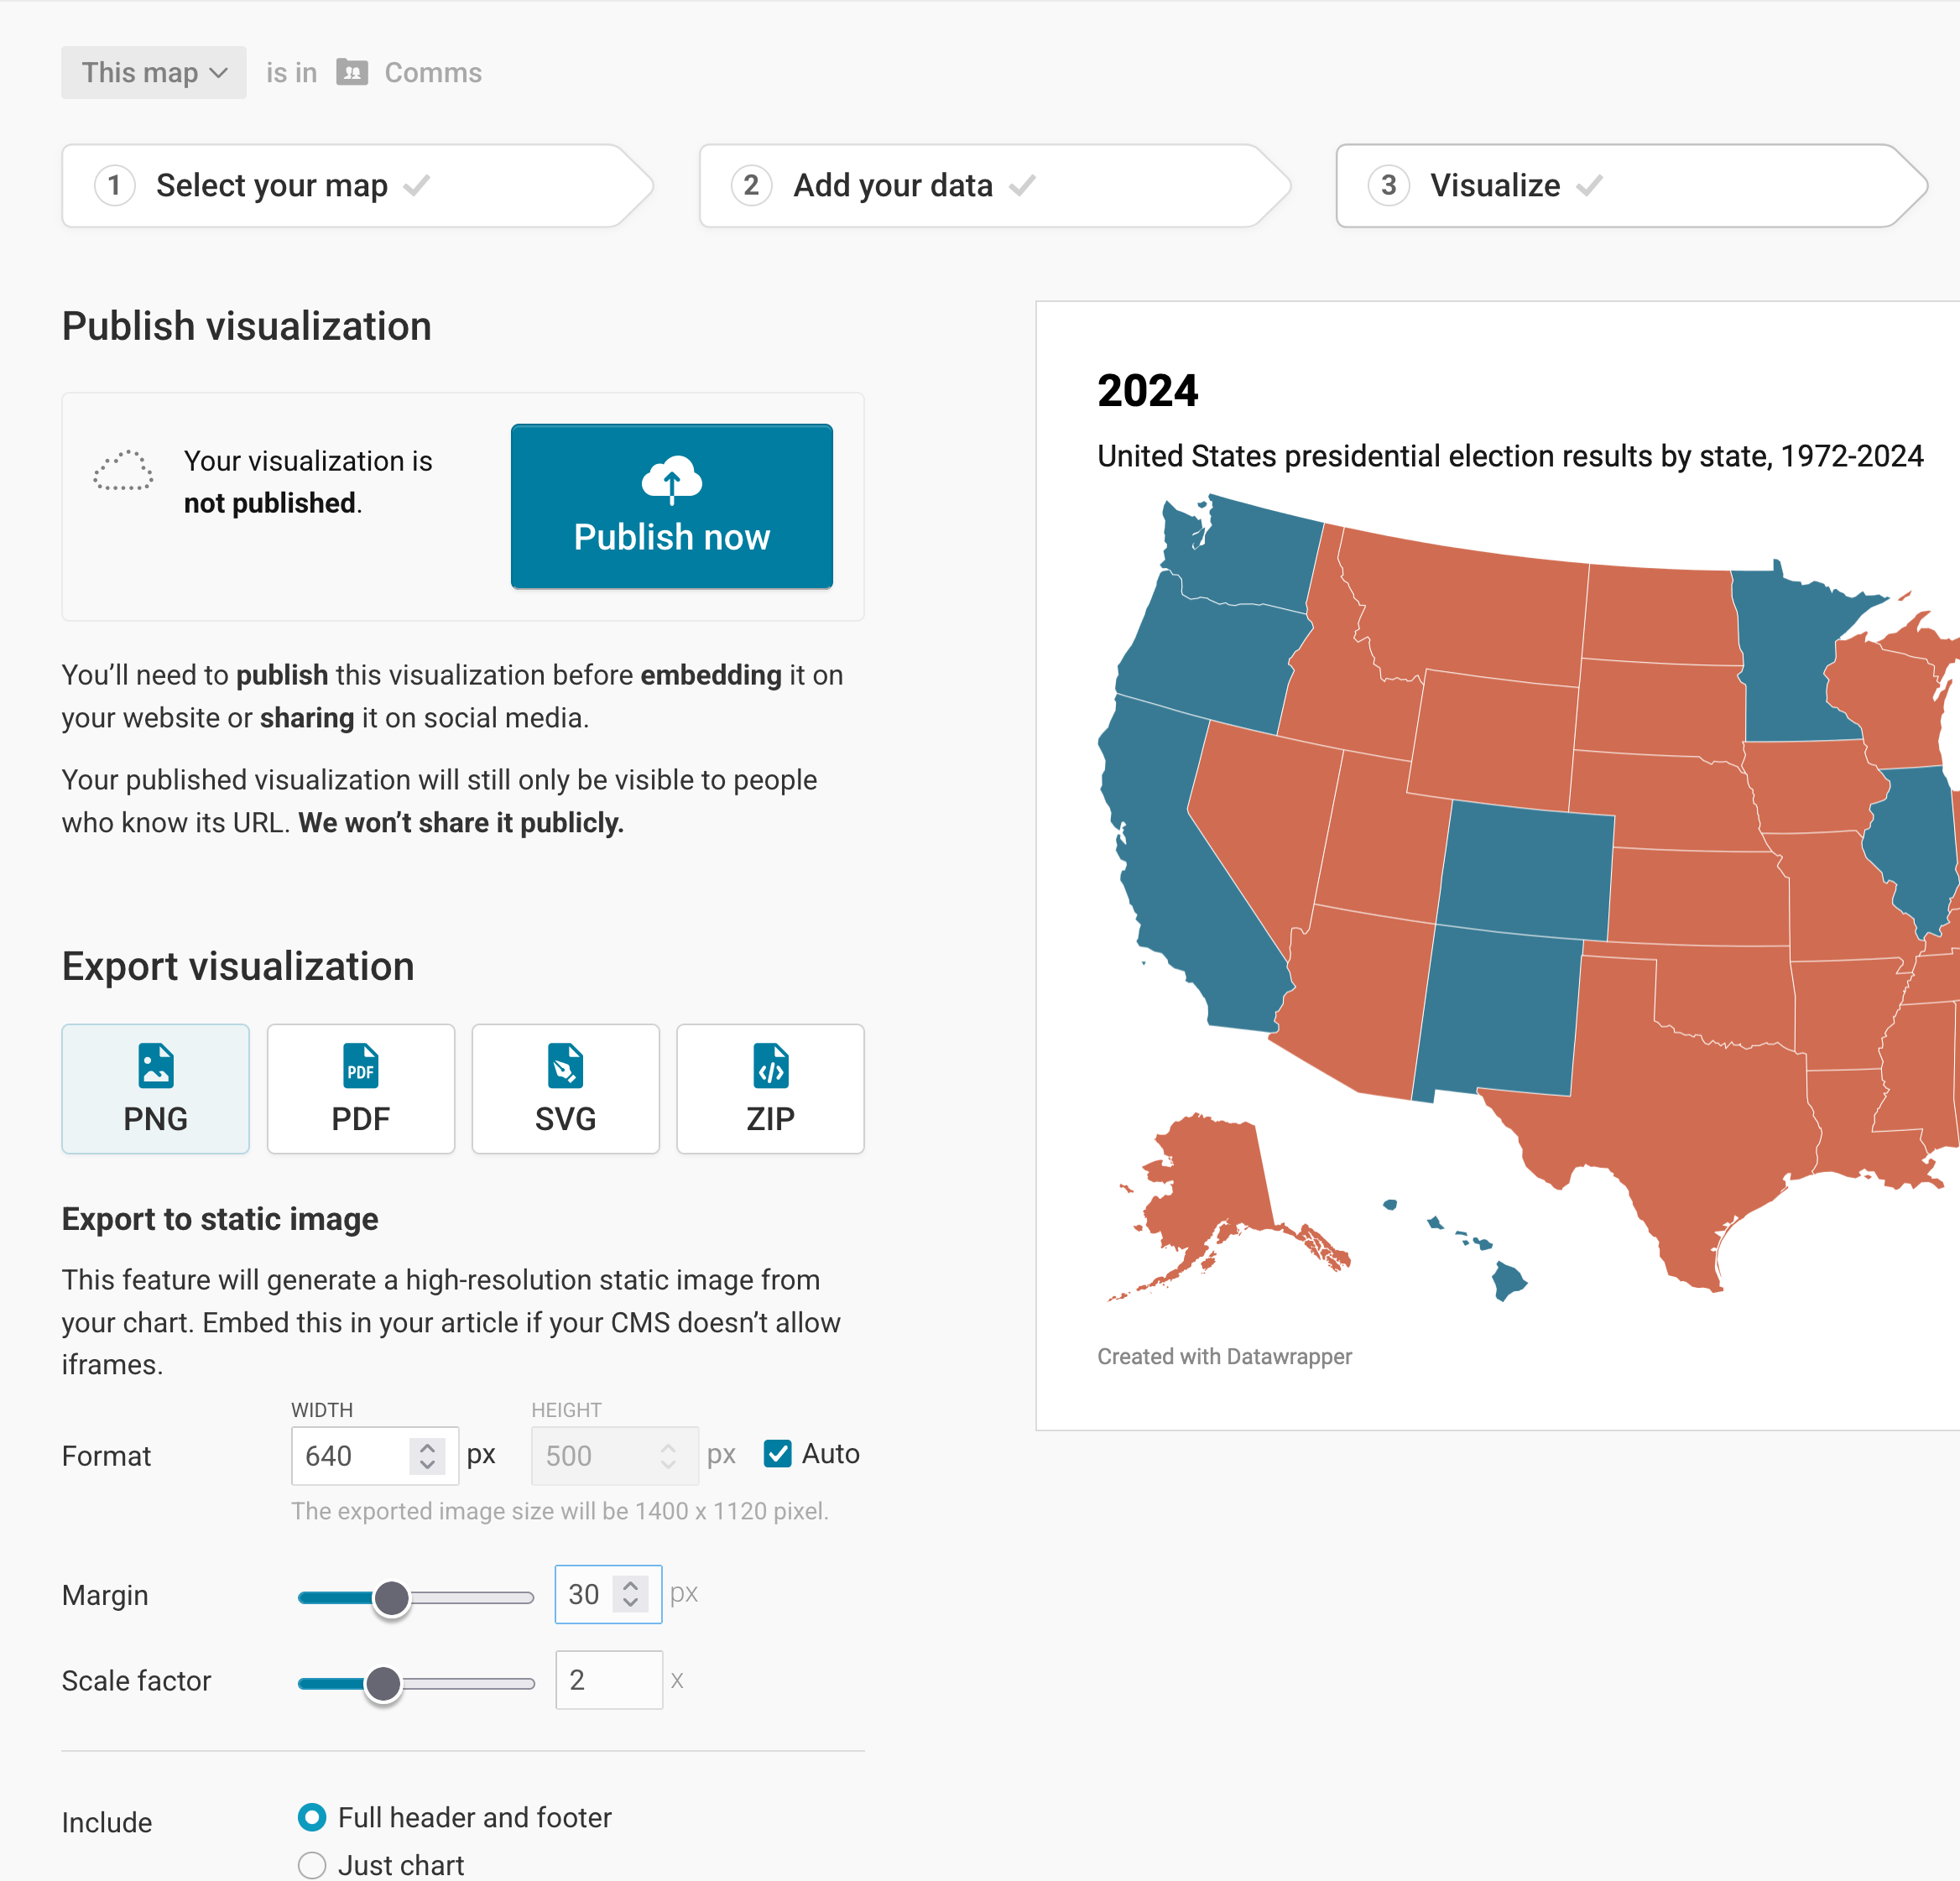
Consider giving your visualization a margin and a different scale factor, if necessary.
Now that you have one PNG for each of your columns downloaded on your computer, it's time to turn them into a GIF. There are many tools to do so, on your computer or online. We find the ezgif.com Animated GIF Maker most convenient.
Upload all your images (=frames) and adjust the time you want to see each frame. (Consider giving the last frame a bit more time, so that it doesn't loop without a pause.)
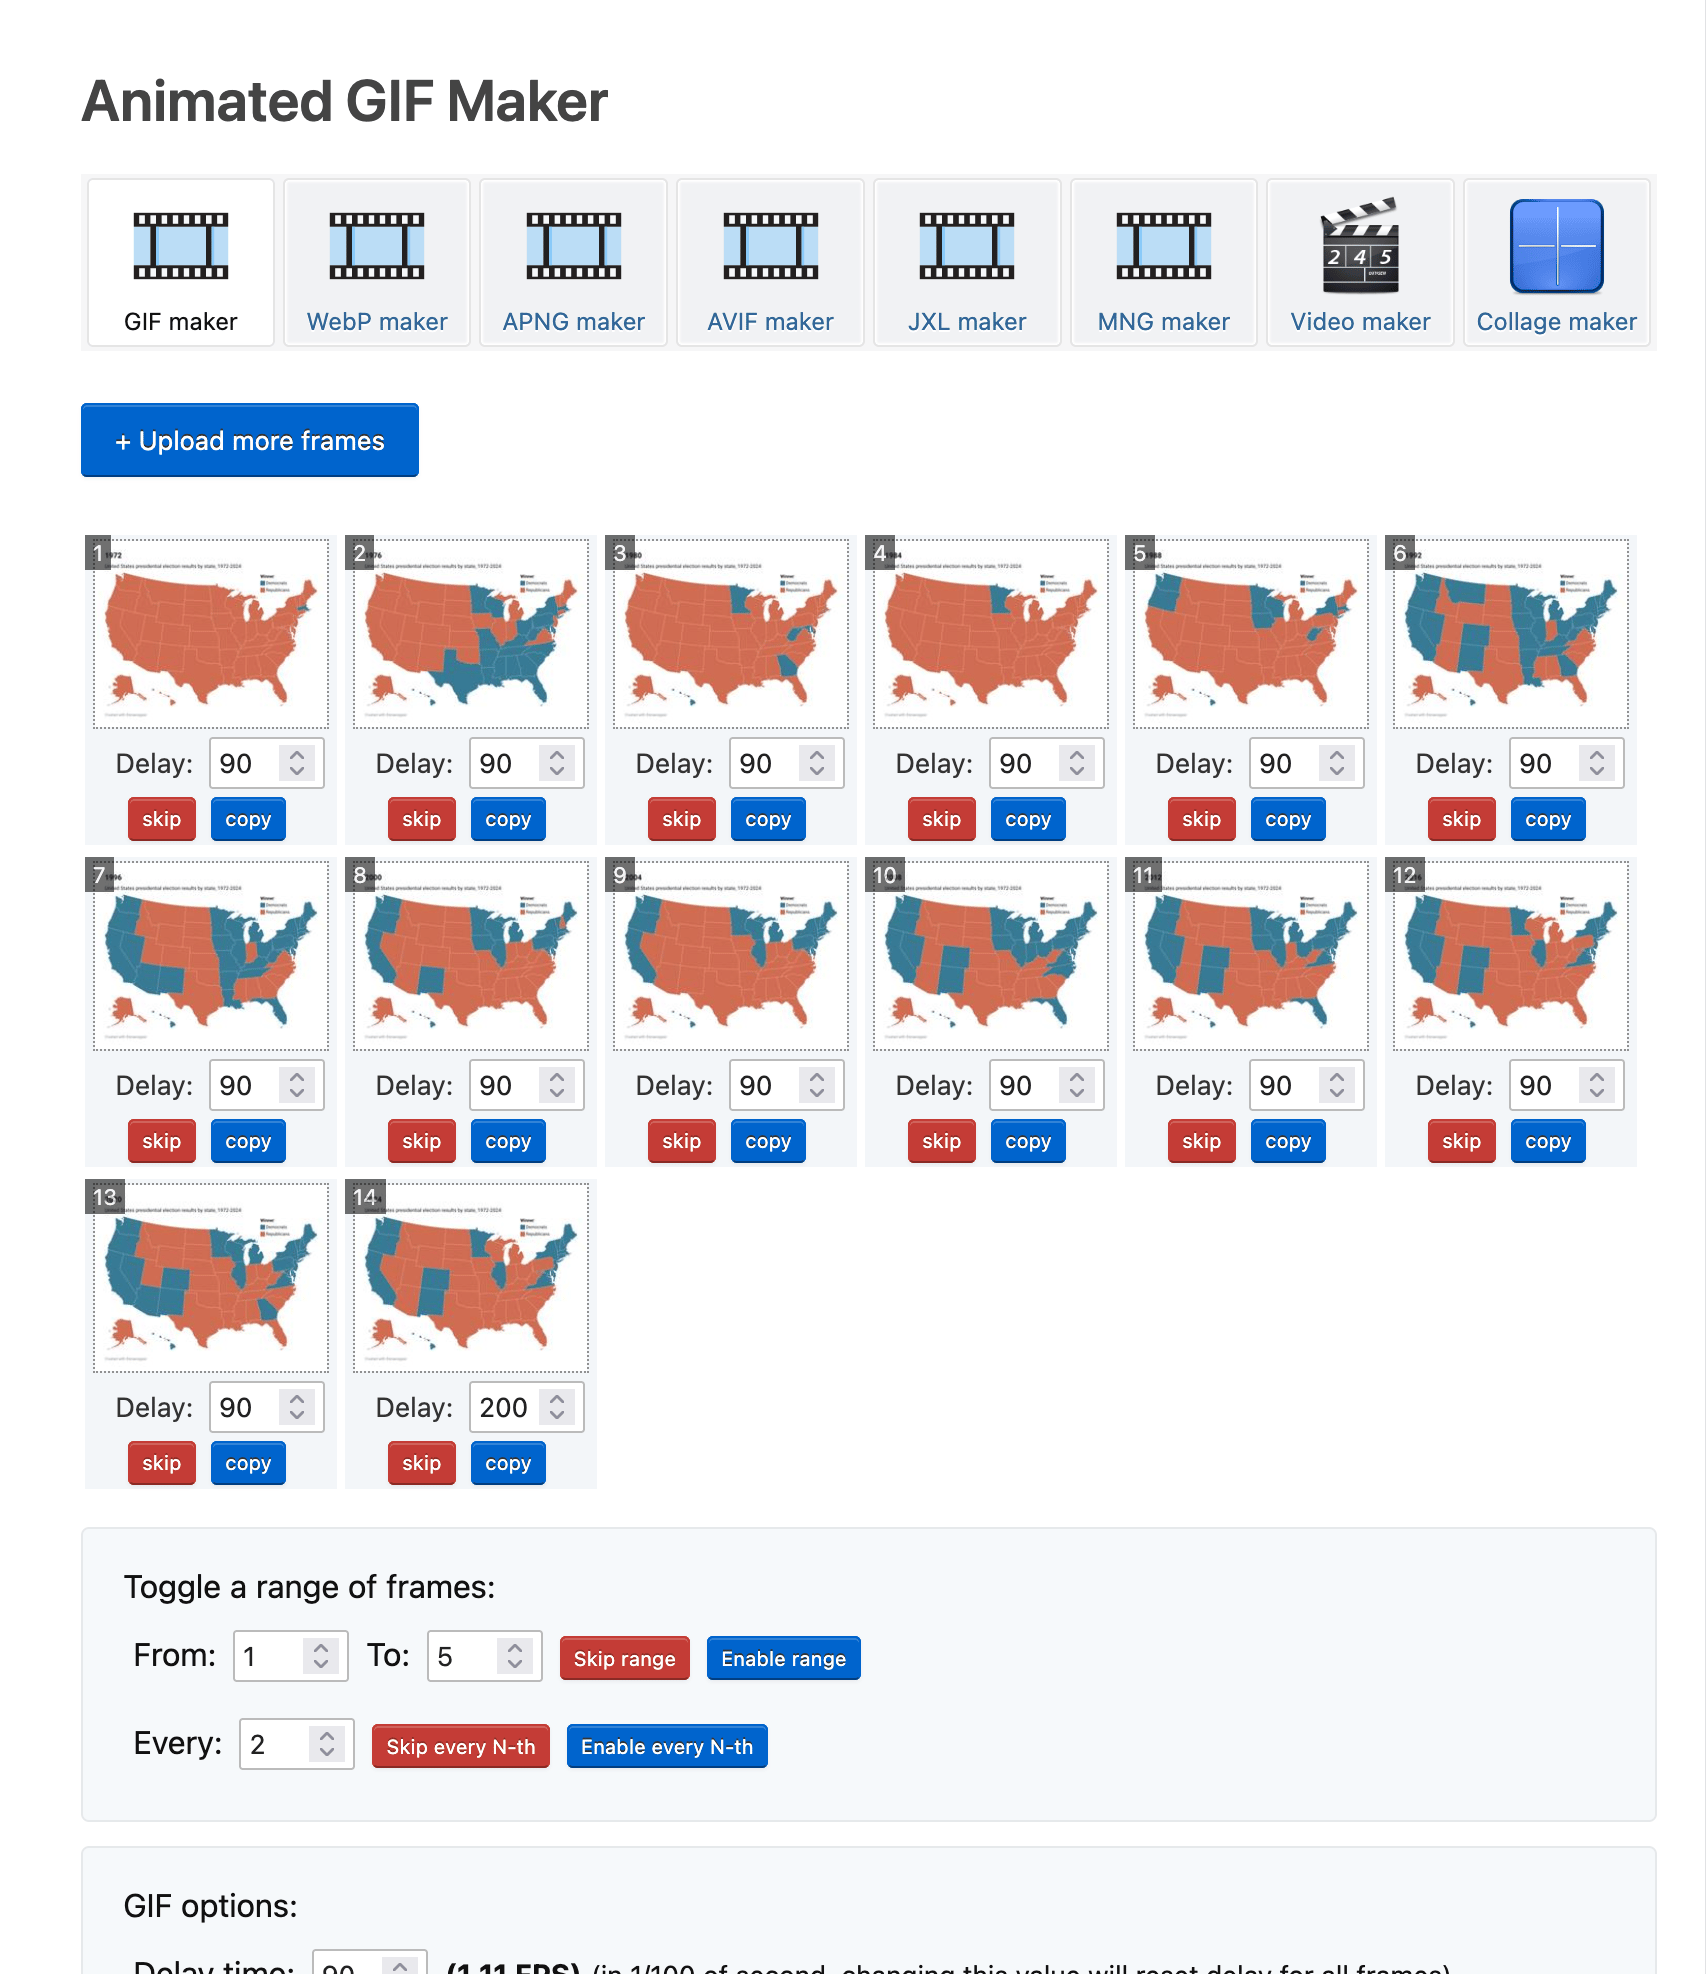
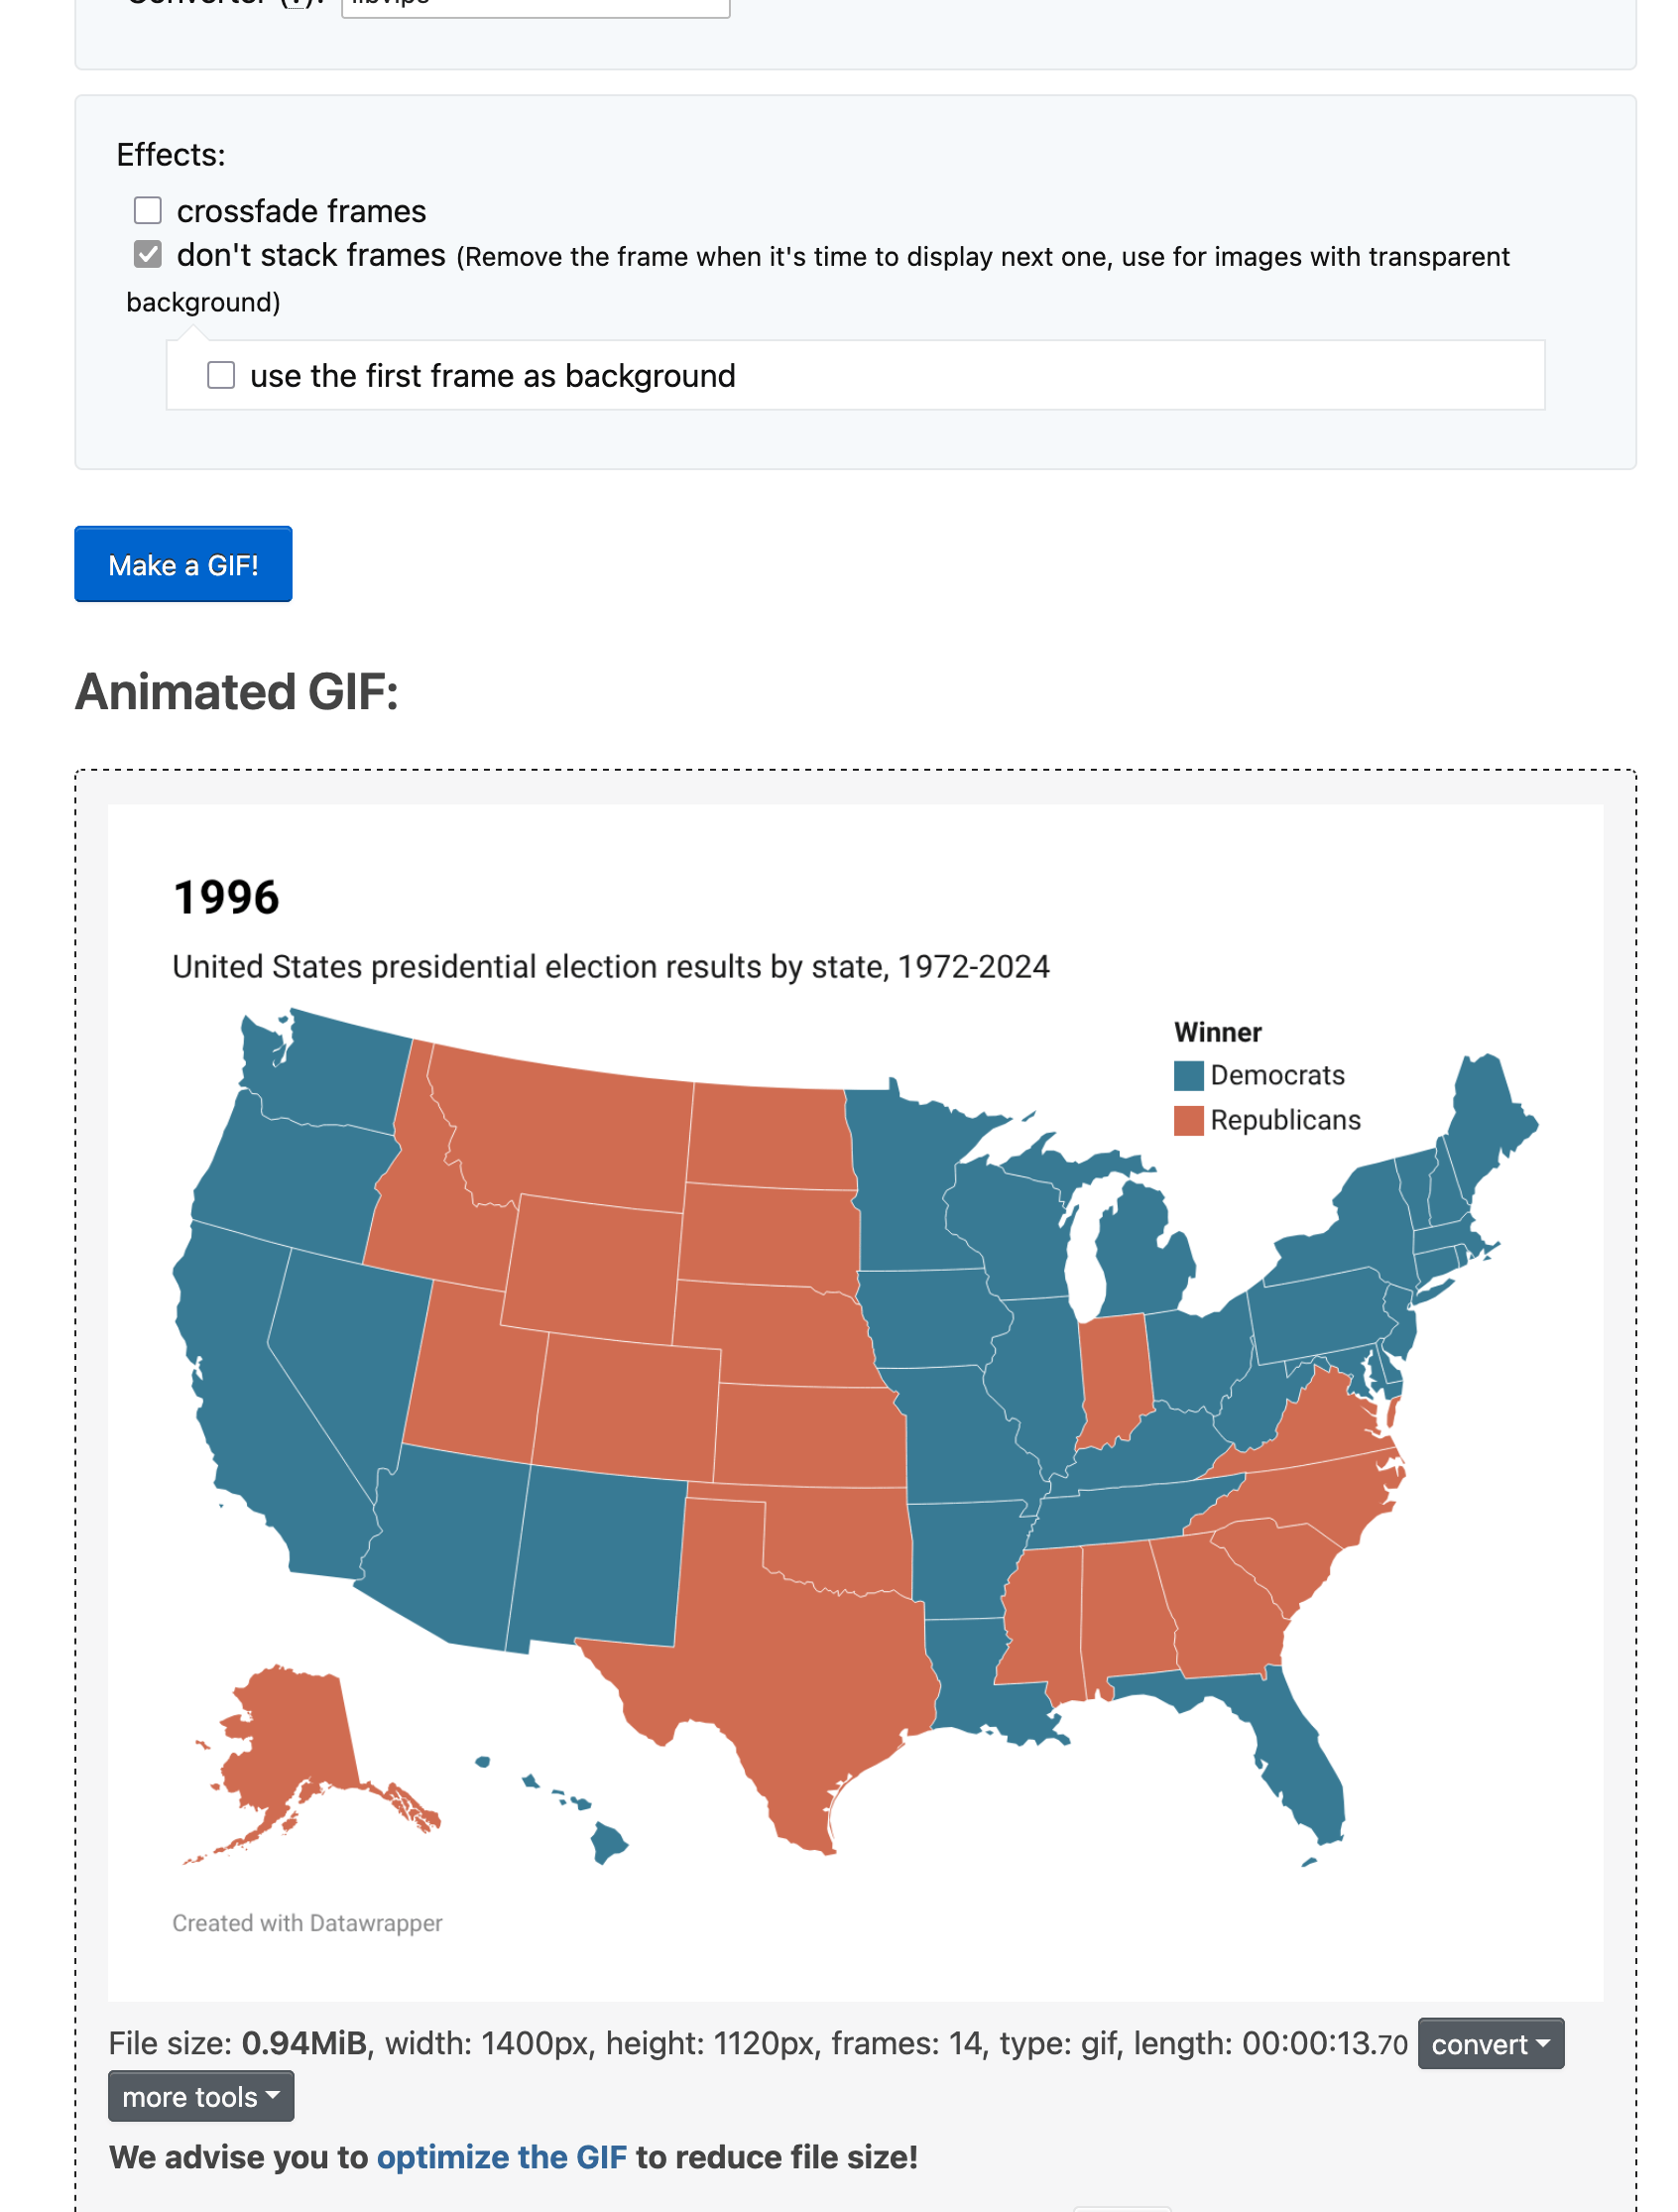
Then scroll down and click on Make a GIF!, and voilà, your GIF will appear within seconds. From there, you can right-click to save it to your computer, or simply drag it into a folder or on your Desktop background.
You can also automate this process by making use of Datawrapper API. There are also a Python library and R package that help you use our API.
Here are some other examples of multiple Datawrapper visualizations that have been stitched together into an animated GIF:
- Sex and census - GIF of choropleth maps showing the number of women for every hundred men by county over the past 2 centuries
- Game of Life - GIF created using multiple Datawrapper tables
- Making waterlines in locator maps move: an experiment - GIF created using multiple Datawrapper locator maps
How to create a GIF out of your area chart
And here's how to create a GIF out of a specific area chart from the blog post A shrinking surplus of women:
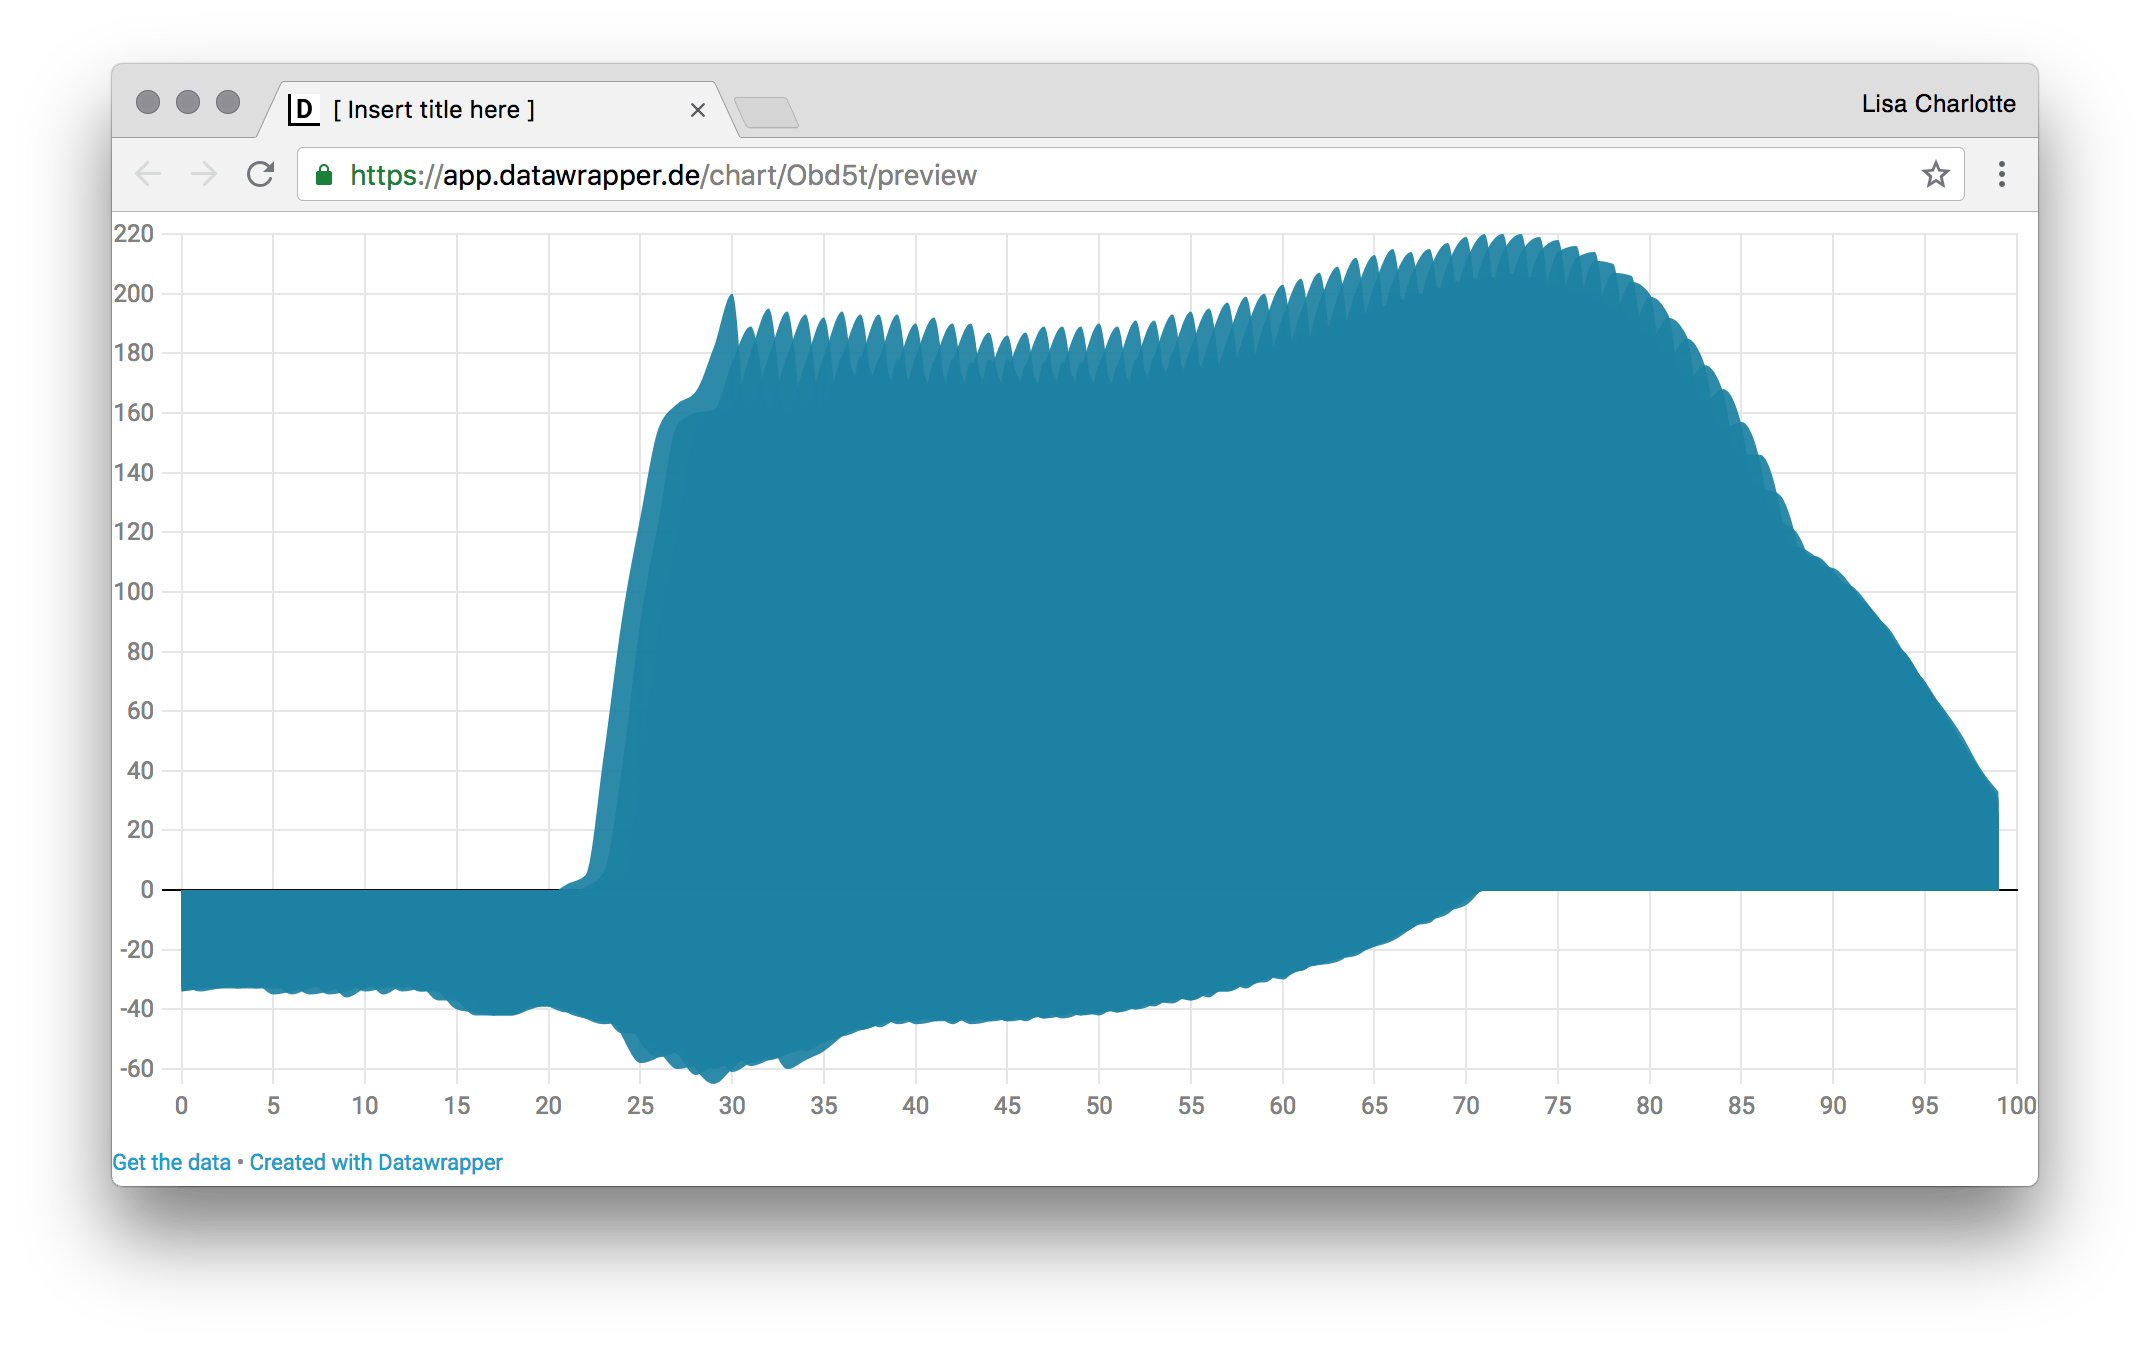
To create this GIF, place all areas in one chart and go to the preview page of this chart: https://app.datawrapper.de/chart/YOURID/preview (replace YOURID with the ID that your chart has, e.g. aM2B6. It will look like this:
Now open the developer console. In Chrome, you can do so by pressing Option + Command + J
In the console, copy and paste:
$.getScript('https://rawgit.com/gka/d3-jetpack/master/build/d3v4%2Bjetpack.js') var year = 1950; function step() { d3.selectAll('path.area').style('opacity', d => d.id == year ? 0.85: 0); if (year++ <= 2060) setTimeout(step, 100); } setTimeout(() => { d3.selectAll('path.area').style('opacity',0); setTimeout(step, 2000); }, 3000);You will need to adjust this code to your chart. If your date column is not called "year", but "Years", then you need to replace this. If your first year is not 1950, but 2018; and your last year is not 2060, but 2032, then you need to adjust this, too.
If you click enter, this command will run. It will wait 3 seconds to load D3 from the script at the beginning of the command. Then nothing will happen for 2 seconds. Then it will run through all areas it can find and display them one by one.
You can change the time each area is displayed with changing the number in setTimeout(step, 100);
You can then screencast the result with a GIF software. You can then edit the GIF in a software like Adobe Photoshop.
If you want to display the years, copy and paste this code:
$.getScript('https://rawgit.com/gka/d3-jetpack/master/build/d3v4%2Bjetpack.js') var year = 1950; var div; function step() { div.html(year); d3.selectAll('path.area').style('opacity', d => d.id == year ? 0.85: 0); if (year++ <= 2059) setTimeout(step, 120); } setTimeout(() => { div = d3.select('body').append('div').st({position:'absolute',"font-size":"3em",left:70,top:110}) d3.selectAll('path.area').style('opacity',0); setTimeout(step, 100); }, 3000)<br>It will look like this (you can add the "Year" as a an annotation in Datawrapper):