A collection of Datawrapper pro tips

You've worked through our Getting started section? You've created a Datawrapper visualization or ten? Or you already have lots of experience with creating data visualizations in other tools? Then it's time to level up. Here you'll find ideas that let you create more useful and beautiful charts, maps, and tables, and use Datawrapper more efficiently.
Connecting to Google Sheets
If you work in Google Sheets, connect it with Datawrapper in step 1. Now when you change the data in your Google Sheet, you just need to reload Datawrapper to see it. No need to go back to step 1 and paste the new data there. Especially if you're still in trial and error mode, this saves a lot of time. Learn how to link to a Google Sheet in this Docs article.
Using Datawrapper from within R / Python
If you work in R or Python, consider using our API with the R library or Python library to directly create charts out of your data analysis workflow. You will also be able to change title, description and notes in charts with live-updating data:
- Learn how to use our API
- Learn how to use the DatawRappr R library
- Learn how to use the Datawrapper Python library
HTML is your friend
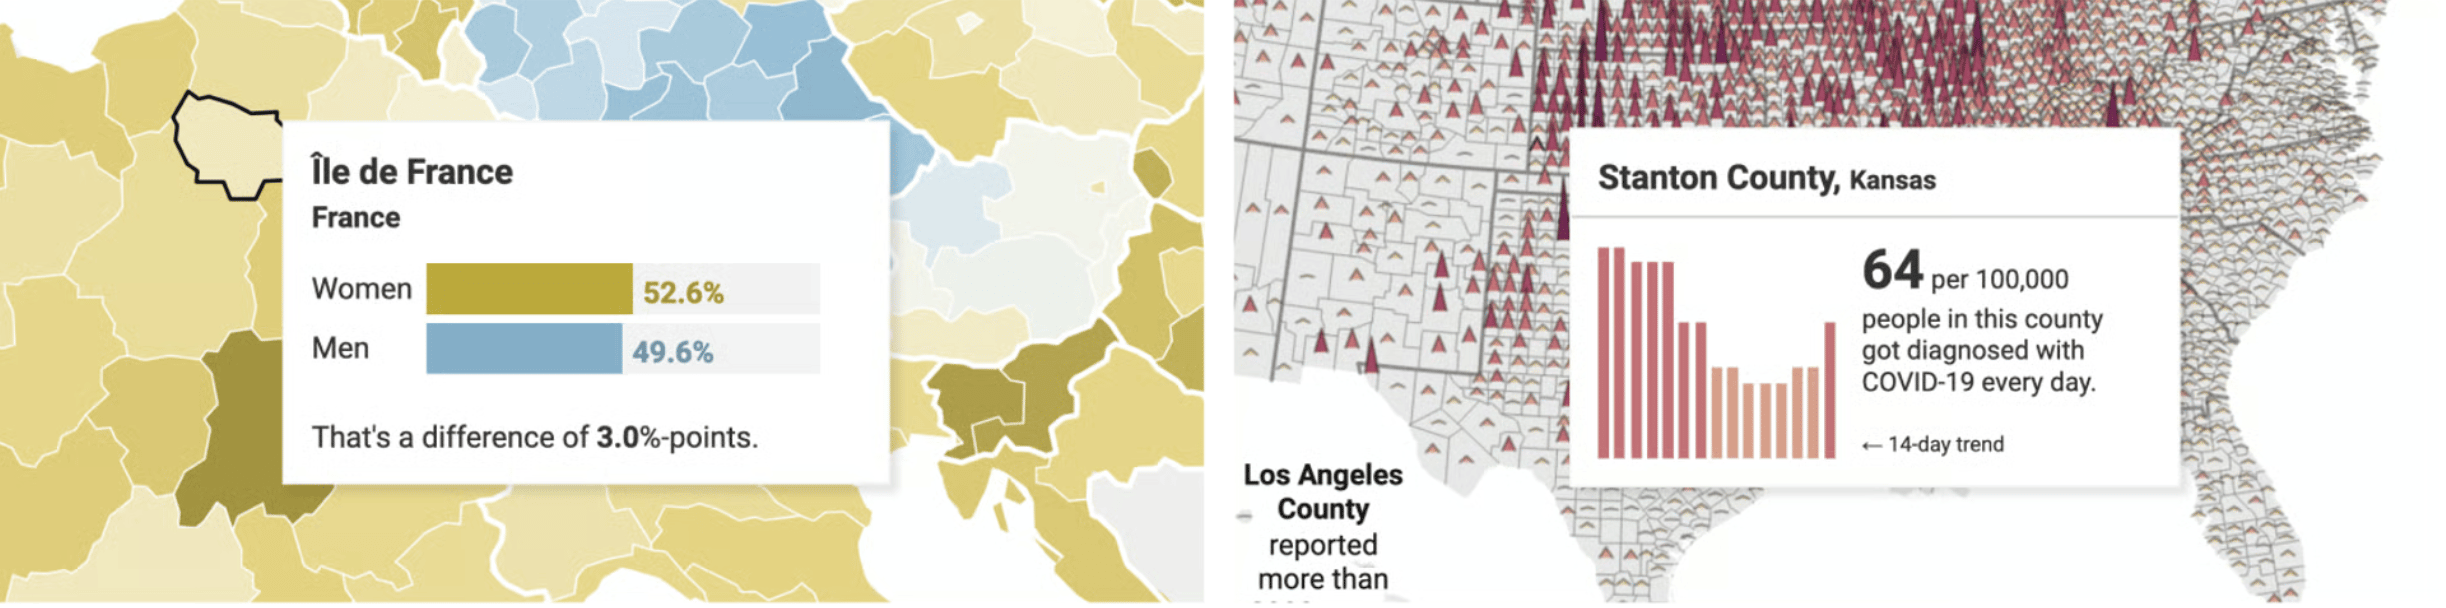
Annotations, tooltips, titles, descriptions, notes, even map color key titles – all of them accept at least a <br> line break, if not an <img> or a <span style="">. Any LLM (like Claude or ChatGPT) will be able to generate some HTML for you, if you tell it what you're envisioning. These Docs articles explain what you can do with HTML:
- How to use HTML & CSS in Datawrapper
- How to customize tooltips
- How to add charts to tooltips
- How to turn your title into a color key
- How to create a custom color key
- How to insert images almost anywhere
- How to insert links in charts, maps & tables
- How to add anchor links in Datawrapper visualizations
- How to add a disclosure widget to show and hide details
- How to add tabs and drop-downs to your visualizations
Some chart types "hide" other ones
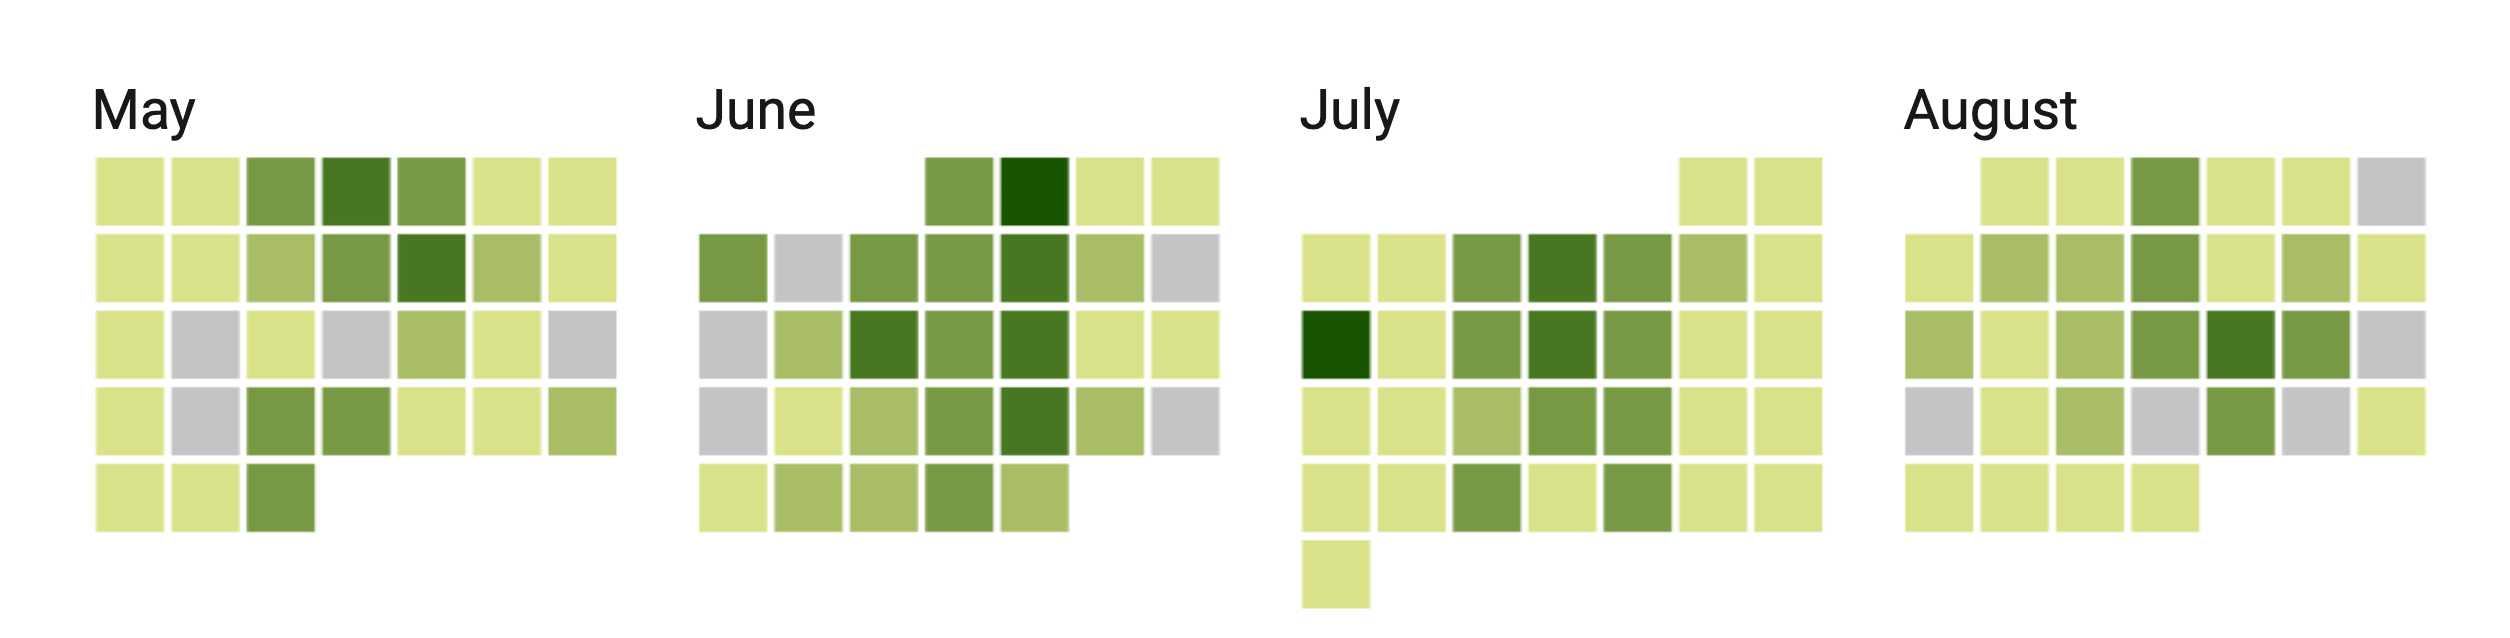
Since our charts come with quite some options, you can create some chart types out of other ones. For example, you can create a slope chart out of a line chart, or a population pyramid out of split bars.
Especially scatter plots are very flexible. Our users have created vertical dot plots, stacked dot charts, line charts and timelines with it. Find more examples of Datawrapper scatter plots here.
Here are more Docs articles that you might find useful:
- How to combine line and column charts in Datawrapper
- How to connect scatterplot dots with lines
- How to create a timeline using scatter plots
- Examples of Datawrapper charts that show complex data
Optimizing your visualizations for mobile screens
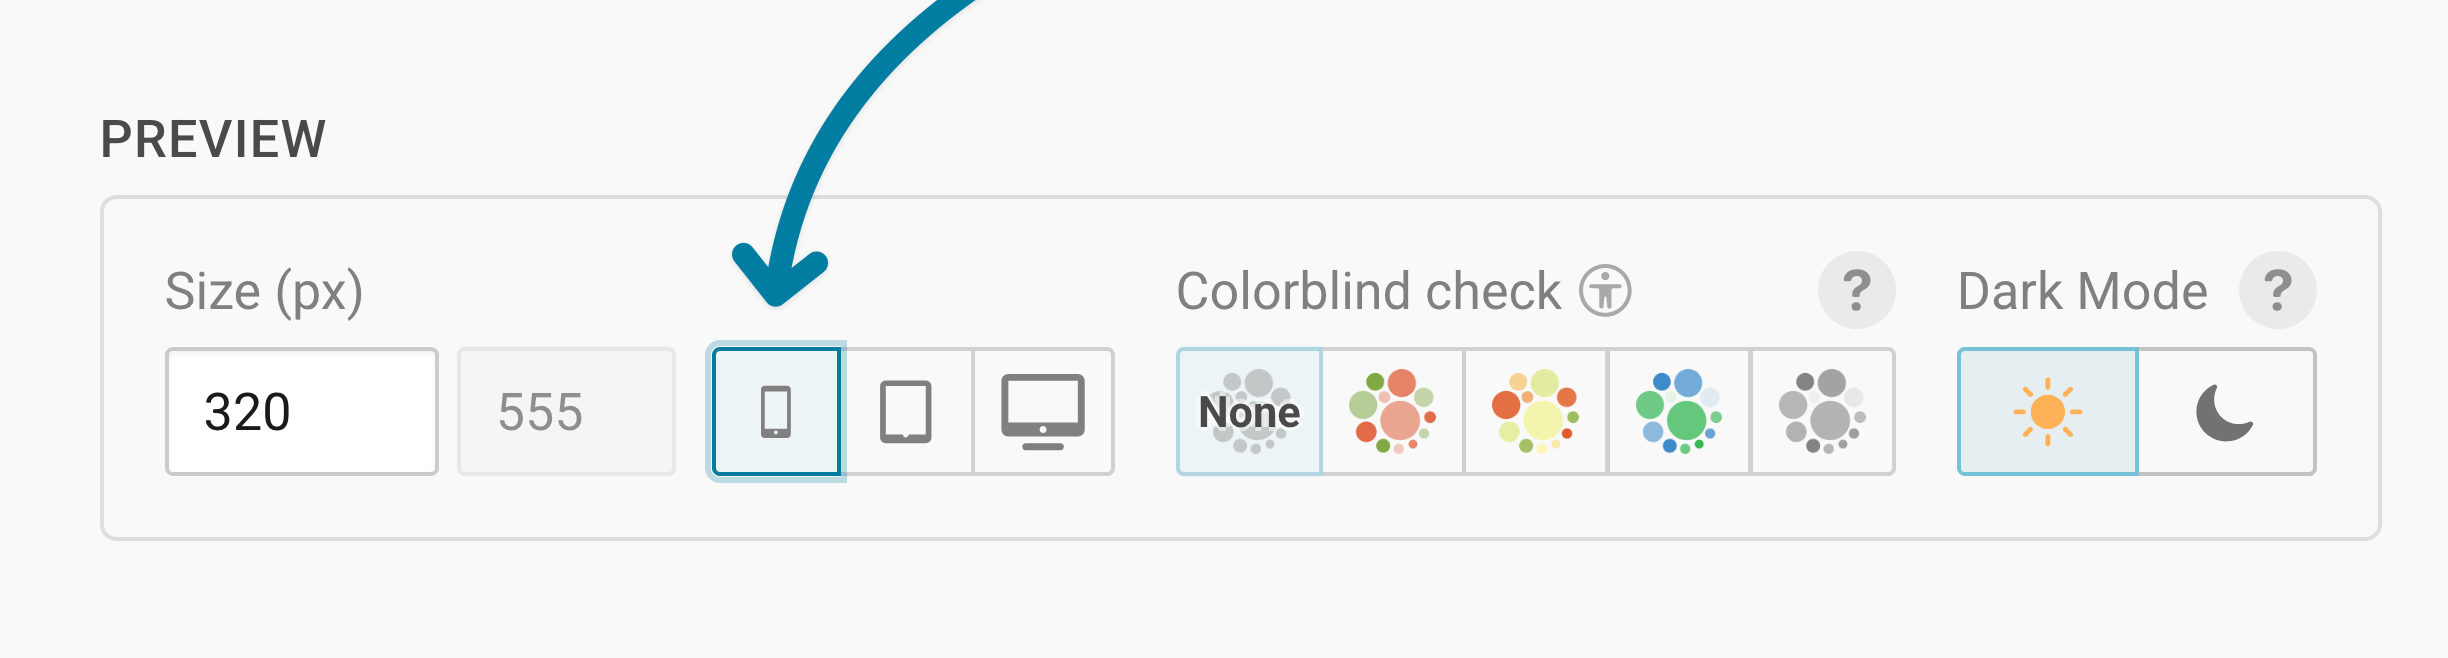
Depending on for which organization you're creating visualizations, most people might see them on their mobile phones. Before publishing your chart, map or table, make sure to check how it looks on narrow screens by clicking on the mobile icon in the Preview panel that you can find below each visualization:
When creating annotations, make use of the offset feature to optimize for mobile. It can be a bit hard to understand, but its necessary to make your visualizations look best on all devices. With the offset option, you can also create beautiful, responsive axis labels. We explain how to use offset well in this Docs article.
Changing your data to be more flexible
If you understand well in which format the Datawrapper app needs your data and how it translates it into your charts, you can use that to your advantage. For example, if you have one line in a line chart over 5 years but want to dash the last two years of it to show that it's a prediction, put the first three years and the last two years in two different columns to be able to style them differently. Here's an example of the multiple-column-trick (click on Edit this chart in the top right to see how it's done):

The same idea works for tables and maps:
- How to color tables by categories (conditional formatting)
- How to display both label and value on choropleth maps
Picking better colors, faster
Our color picker lets you set the lightness and saturation first, and then find the right hue. You can even make colors less opaque/more transparent in the color picker. Learn how to pick colors in Datawrapper.
Supporting dark mode
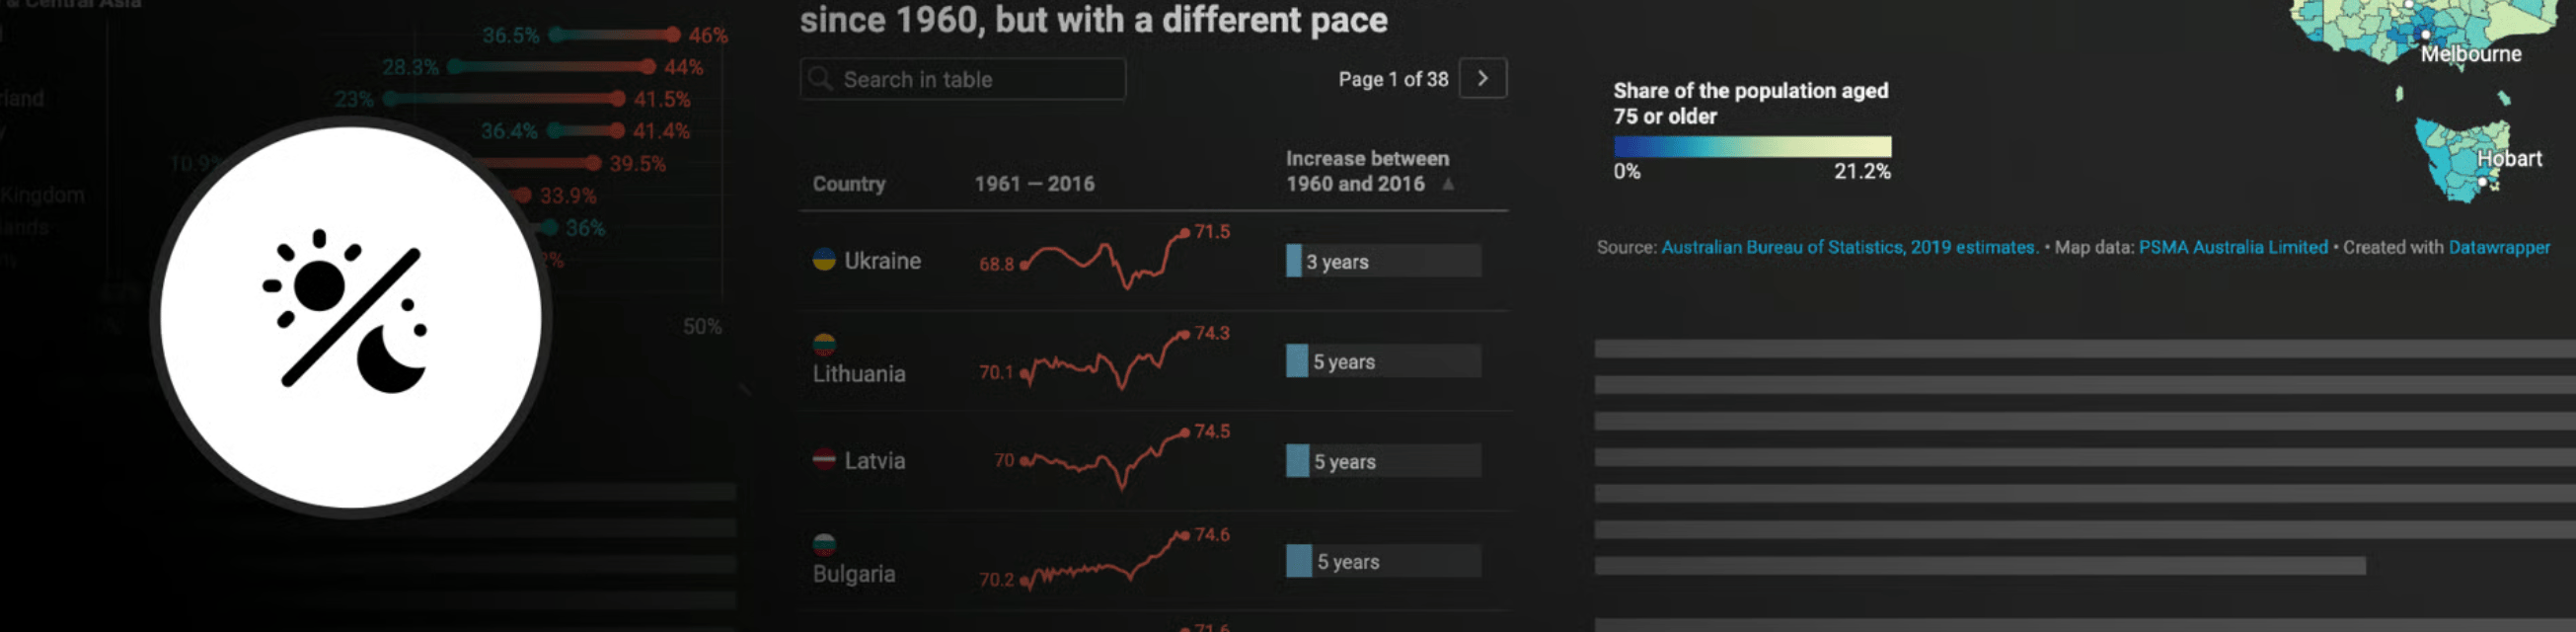
If your website has a dark mode, your Datawrapper visualizations can switch along with it, so that their background becomes dark, too. Learn how to enable dark mode in embedded visualizations.
Keeping your archive tidy
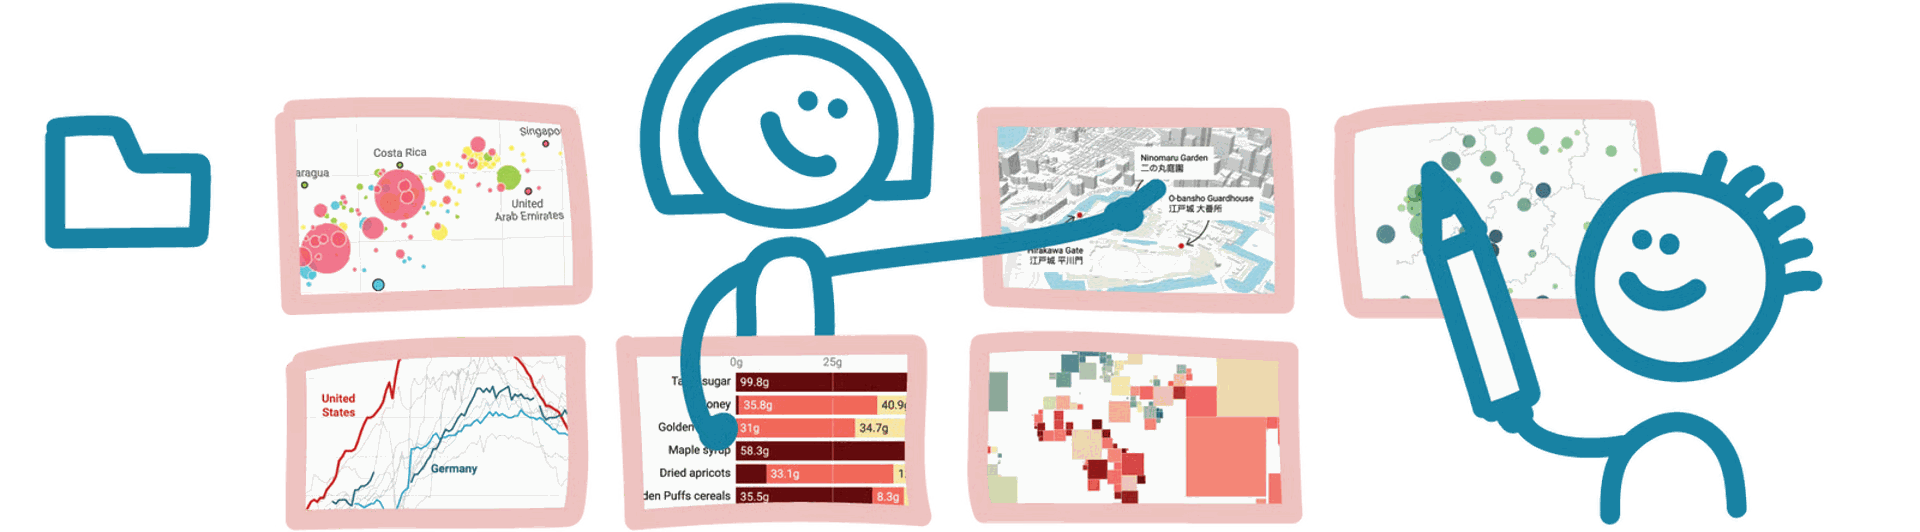
Once you've created hundreds of Datawrapper visualizations or when you're working together in teams, it's a good idea to make heavy use of folders in the Archive. Find ideas for better organizing lots of charts.