Data Vis Dispatch, September 30: Animals, social media, and red lines

Welcome back to the 212th edition of Data Vis Dispatch! Every week, we’ll be publishing a collection of the best small and large data visualizations we find, especially from news organizations — to celebrate data journalism, data visualization, simple charts, elaborate maps, and their creators.
Recurring topics this week include animals, social media, and red lines (in charts).
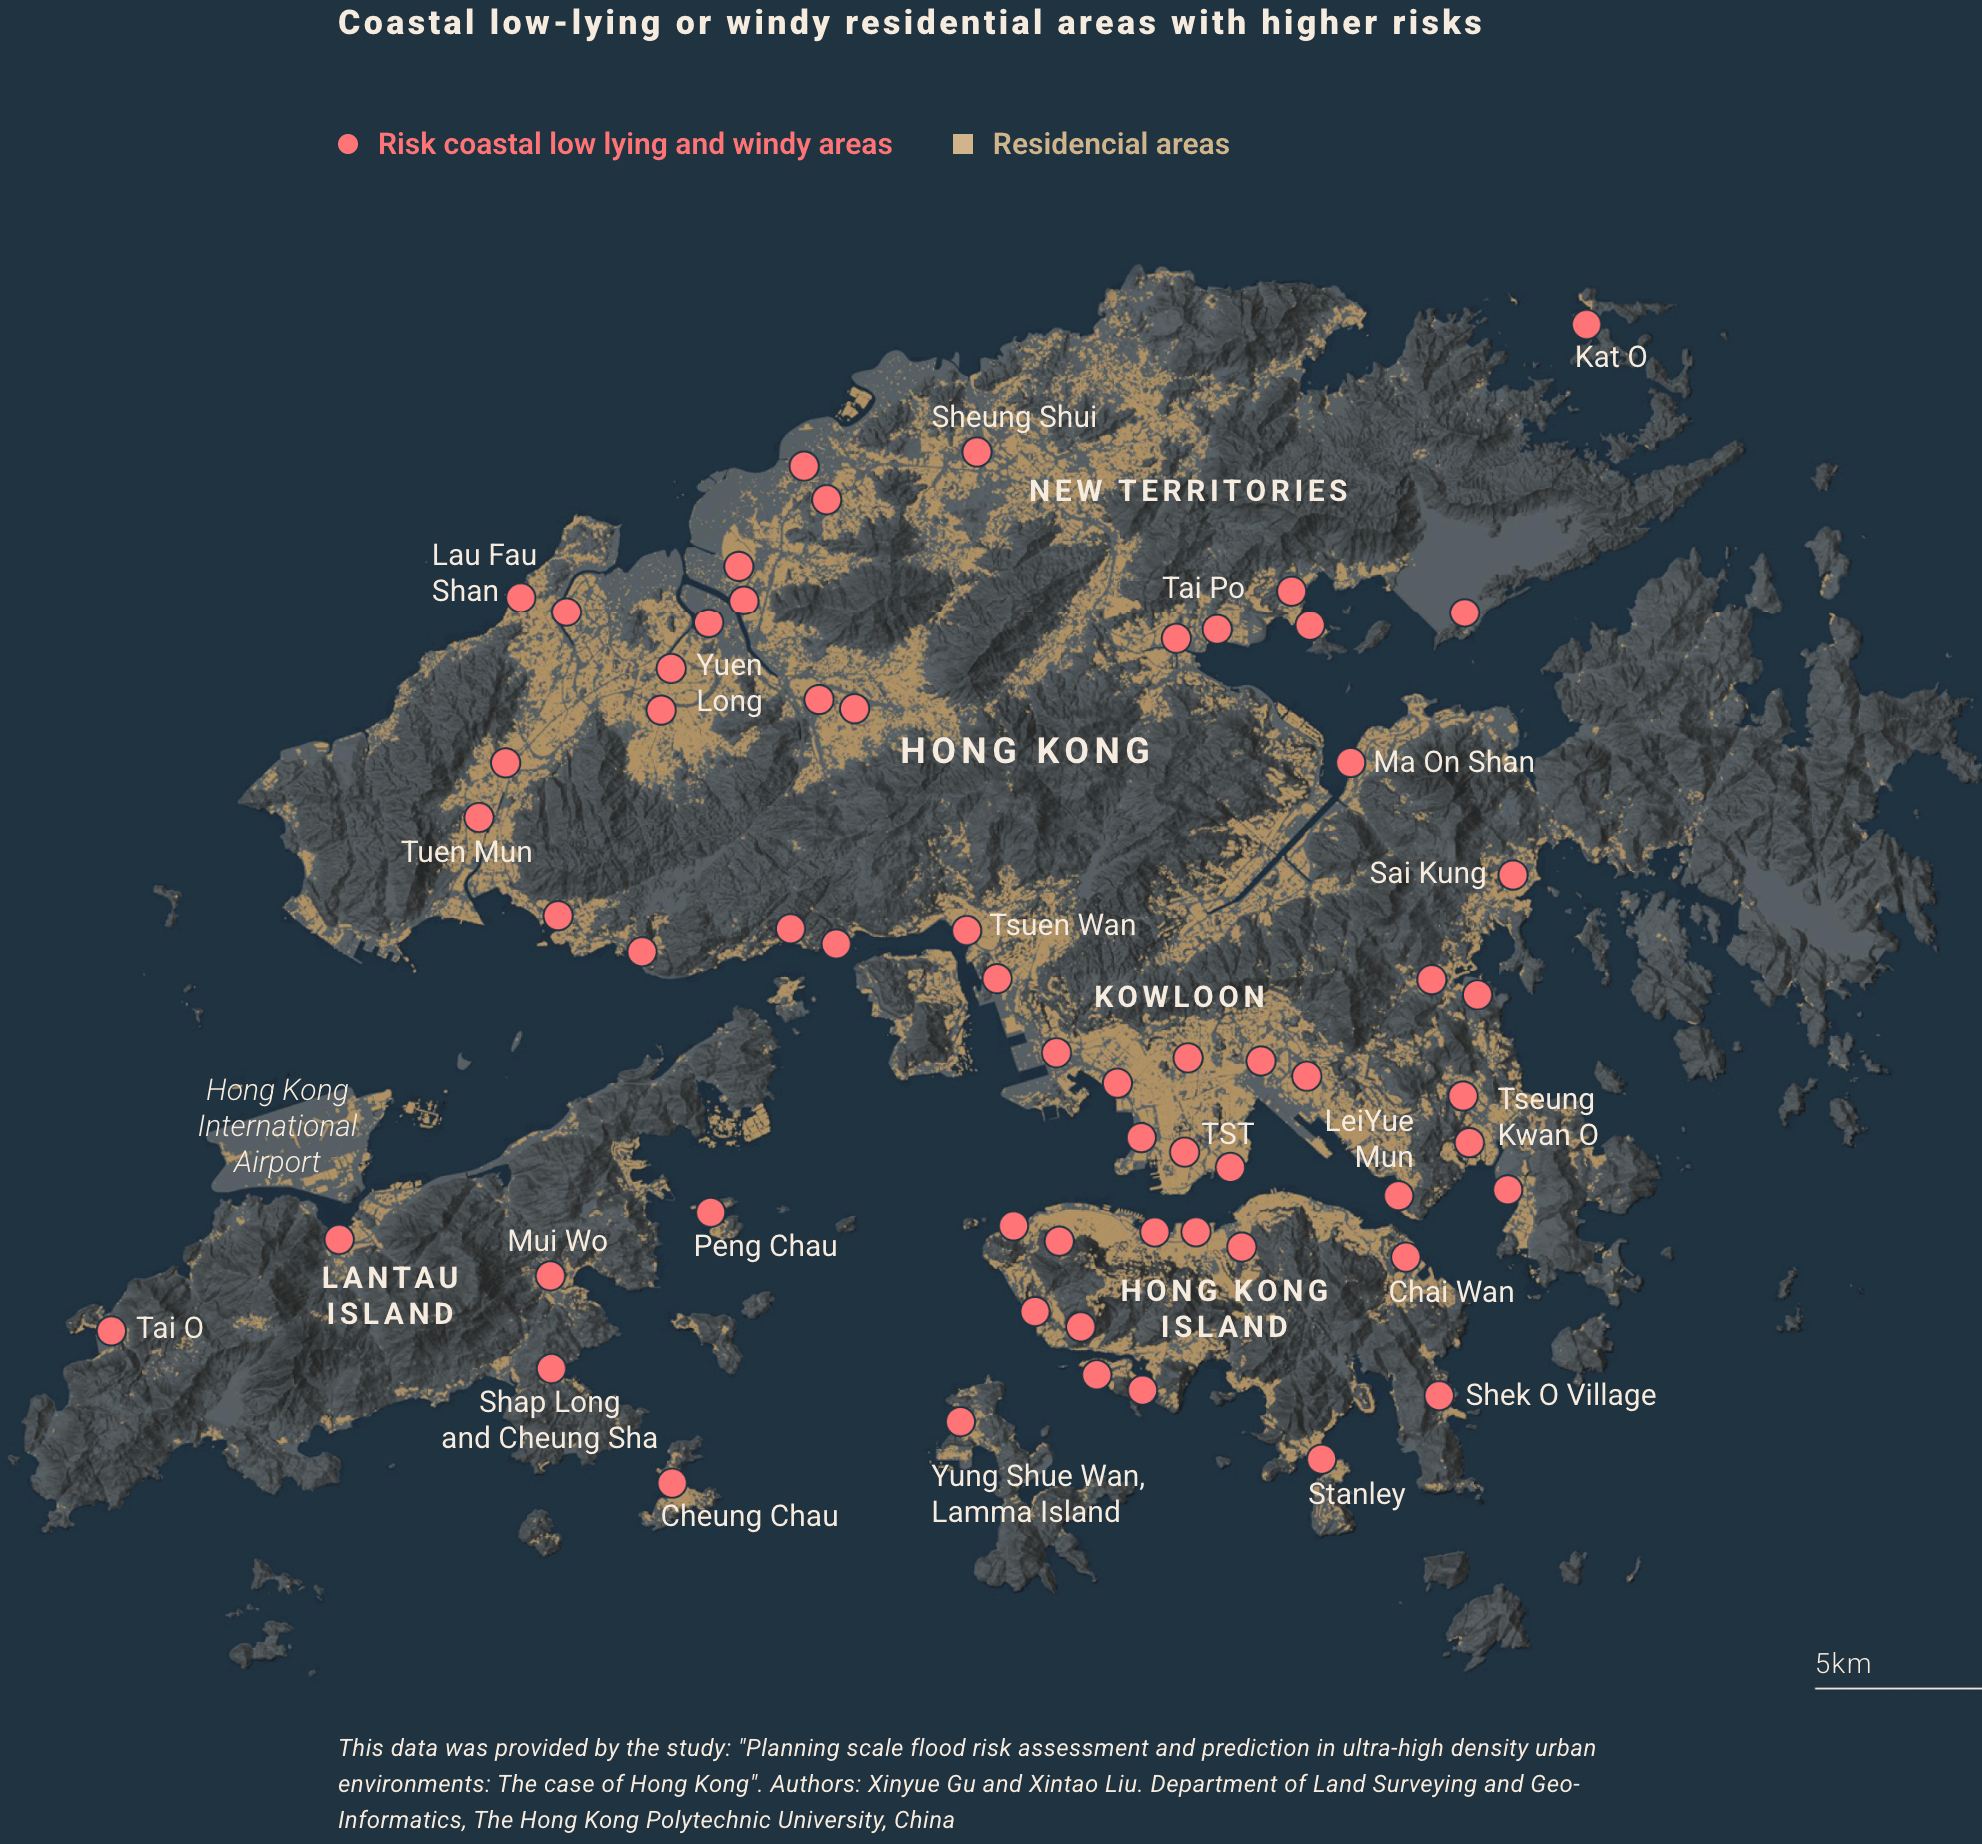
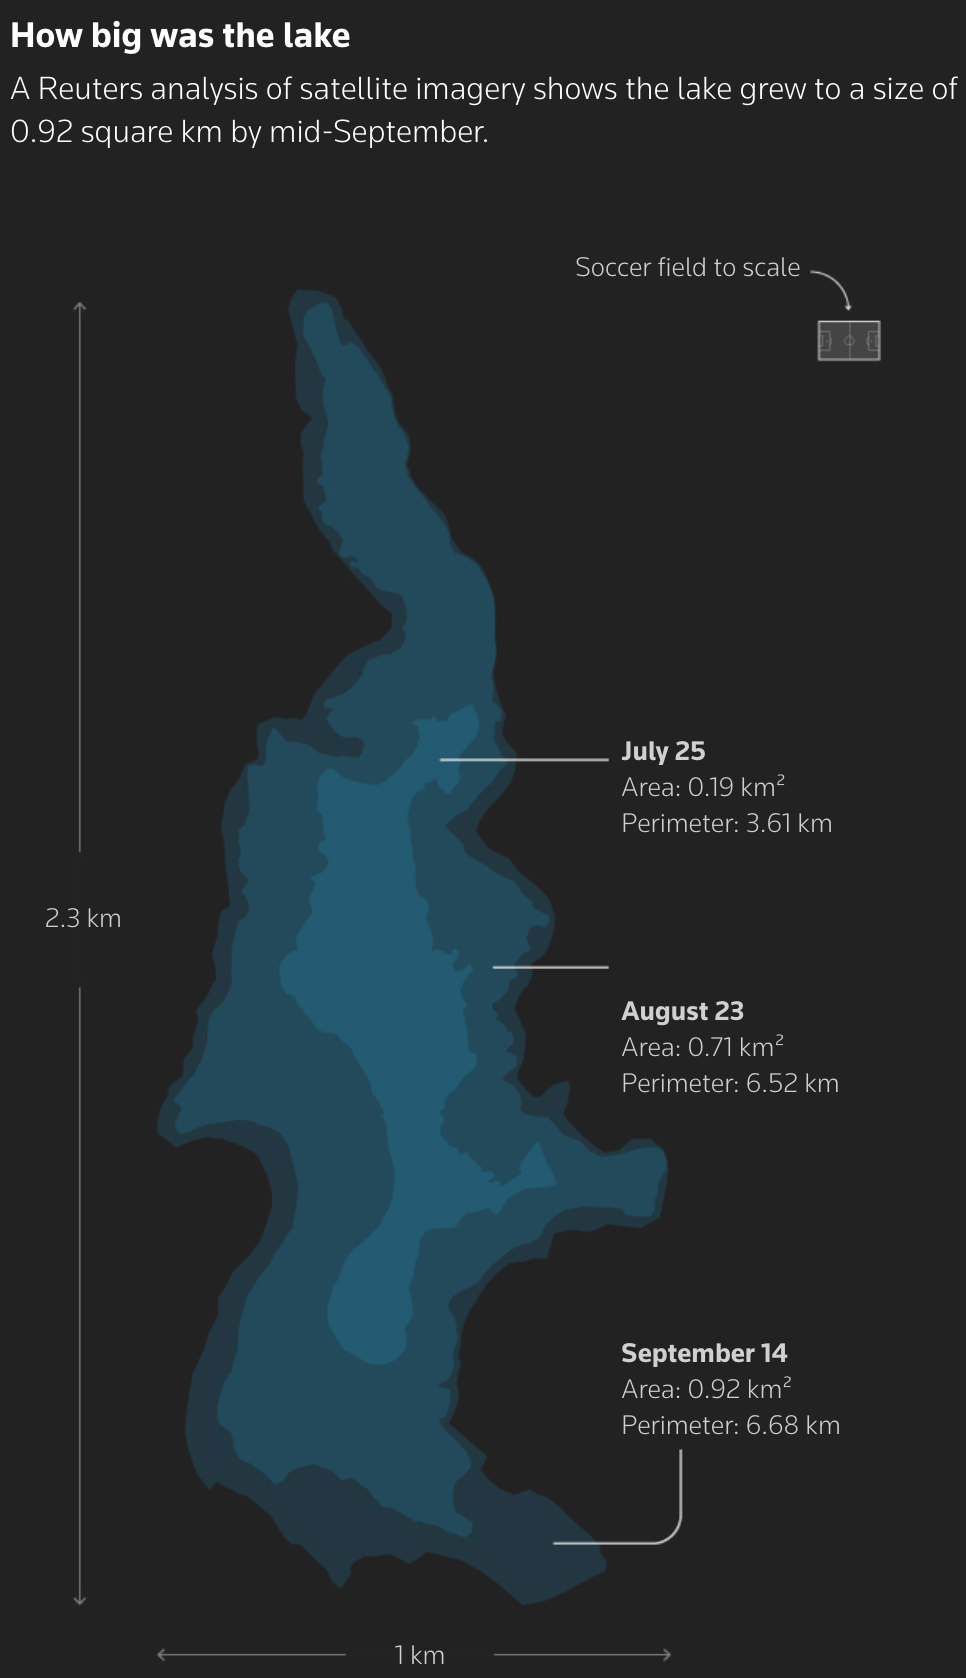
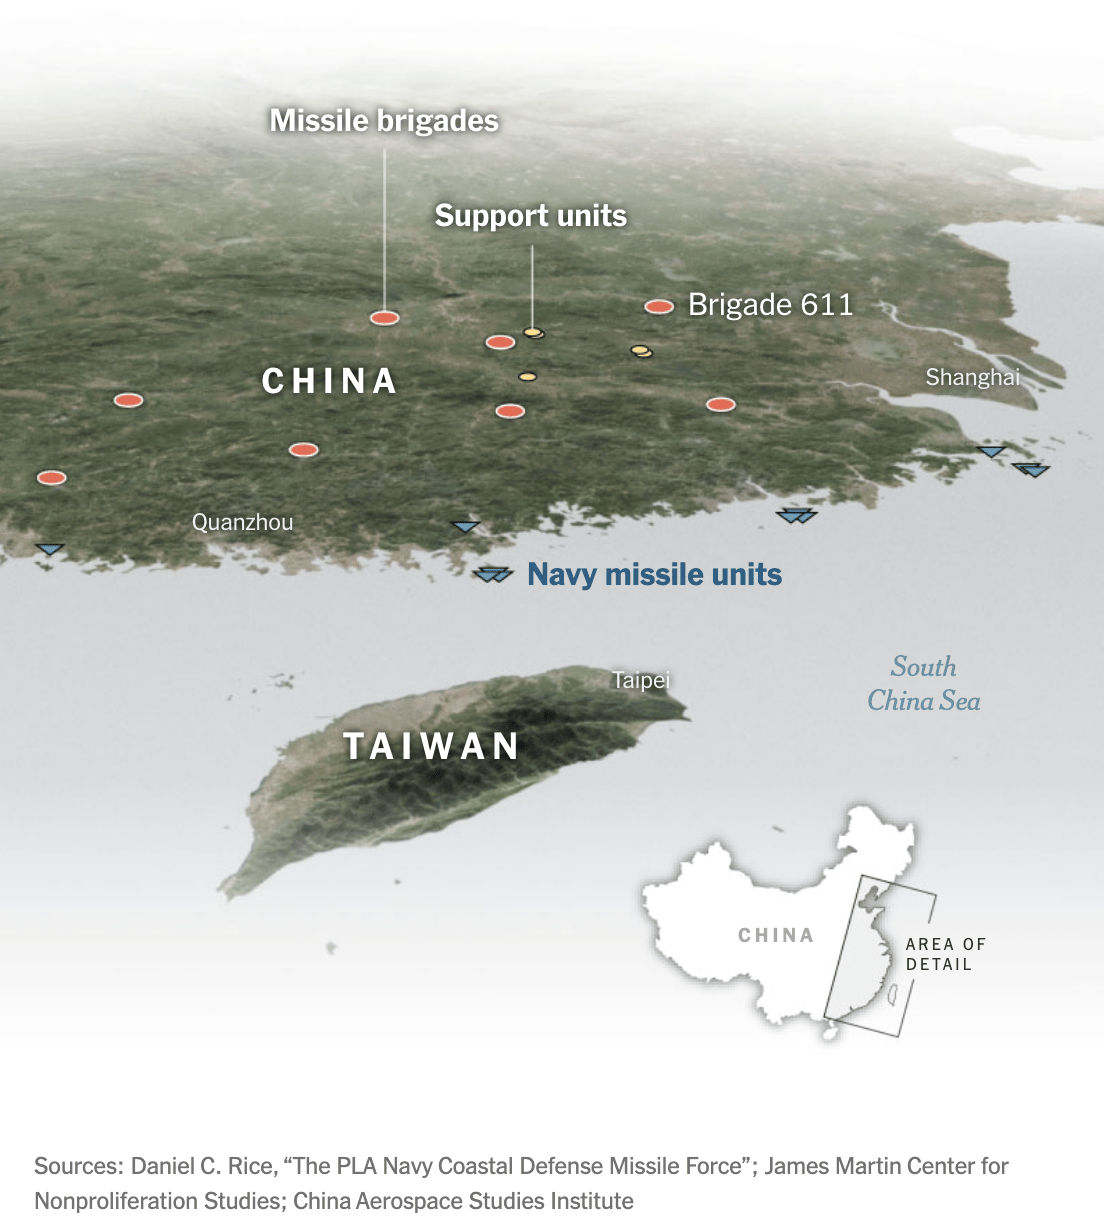
In this Data Vis Dispatch, we take a short trip around the world. First stop: East Asia, where Typhoon Ragasa recently left a trail of devastation in Hong Kong and Taiwan. Meanwhile, China is transforming parts of its eastern coast into bases for potential strikes on Taiwan.
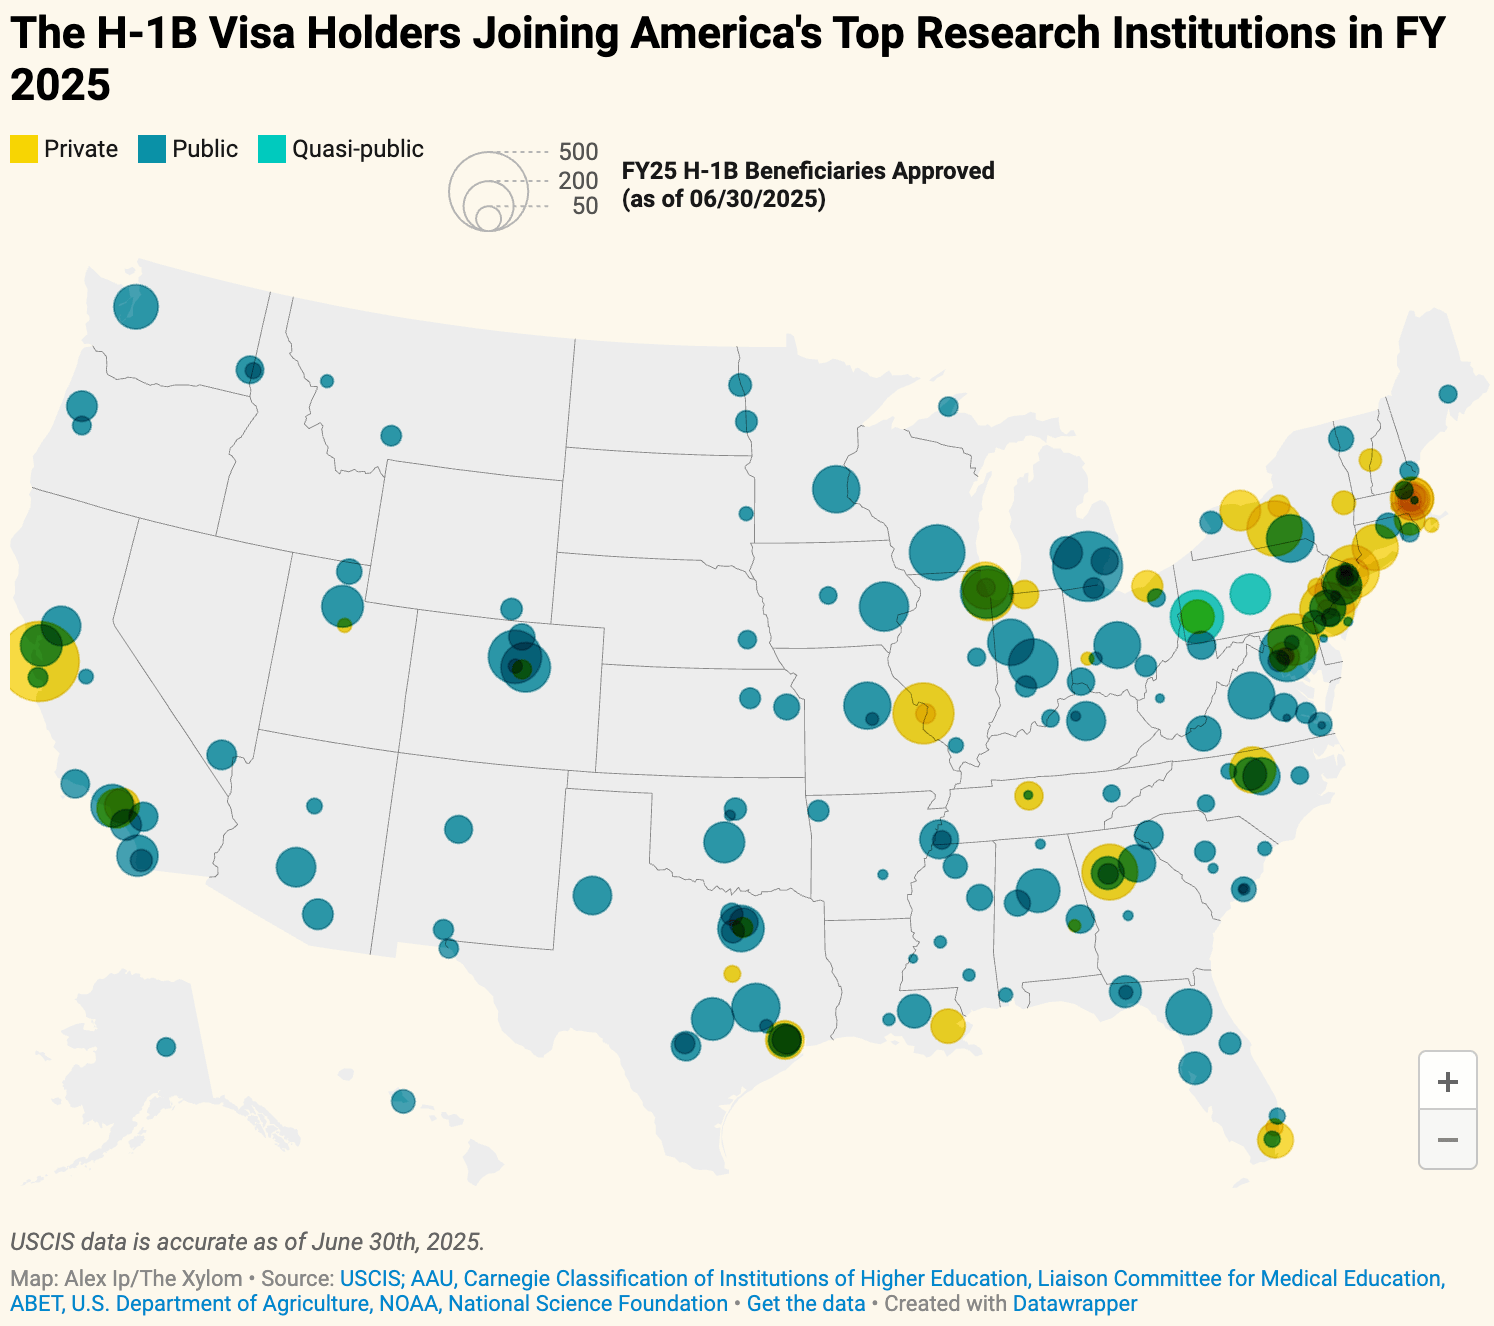
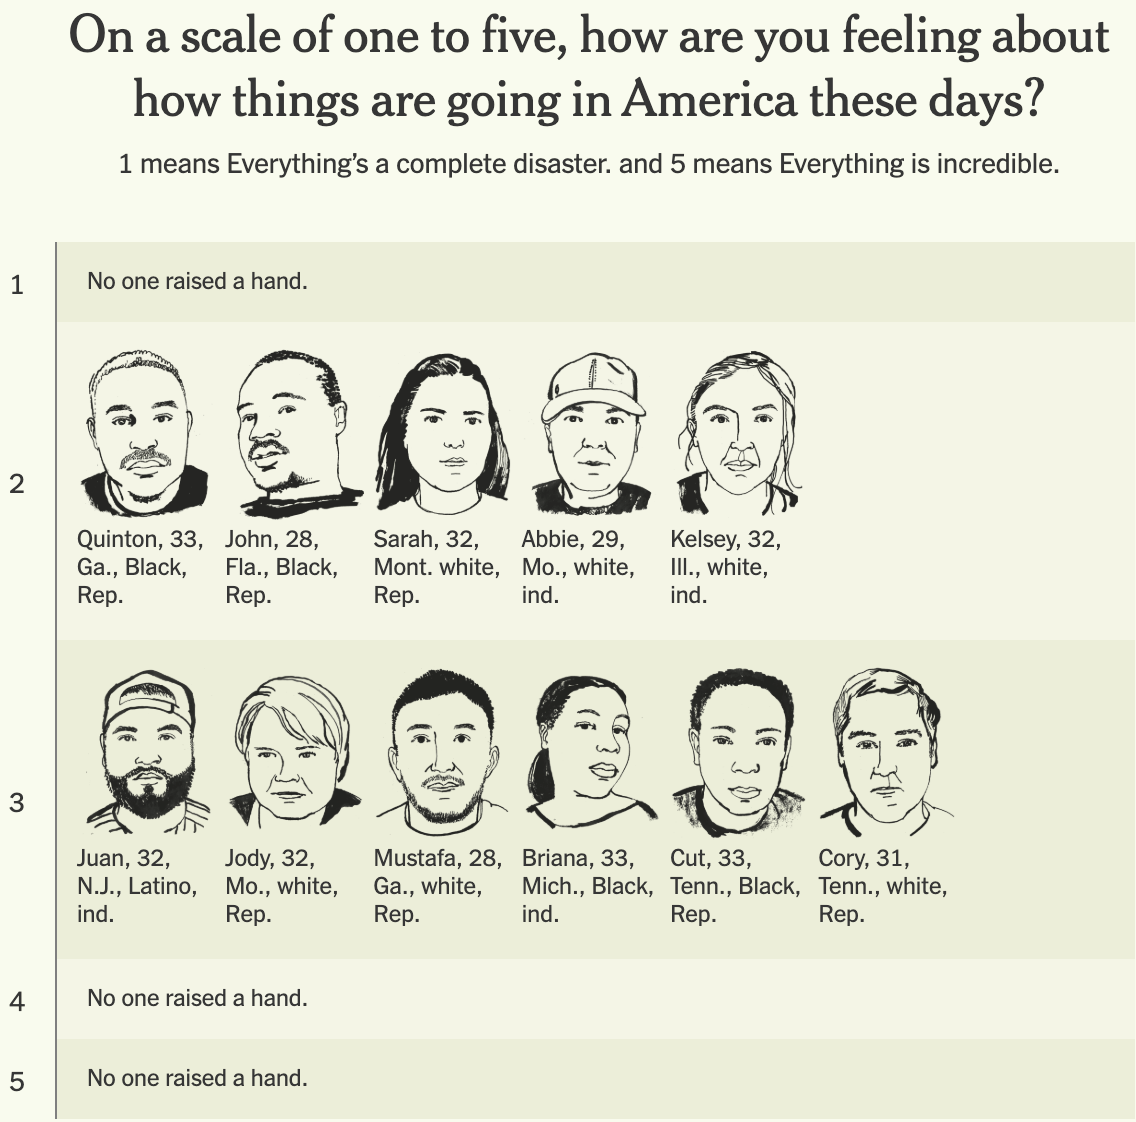
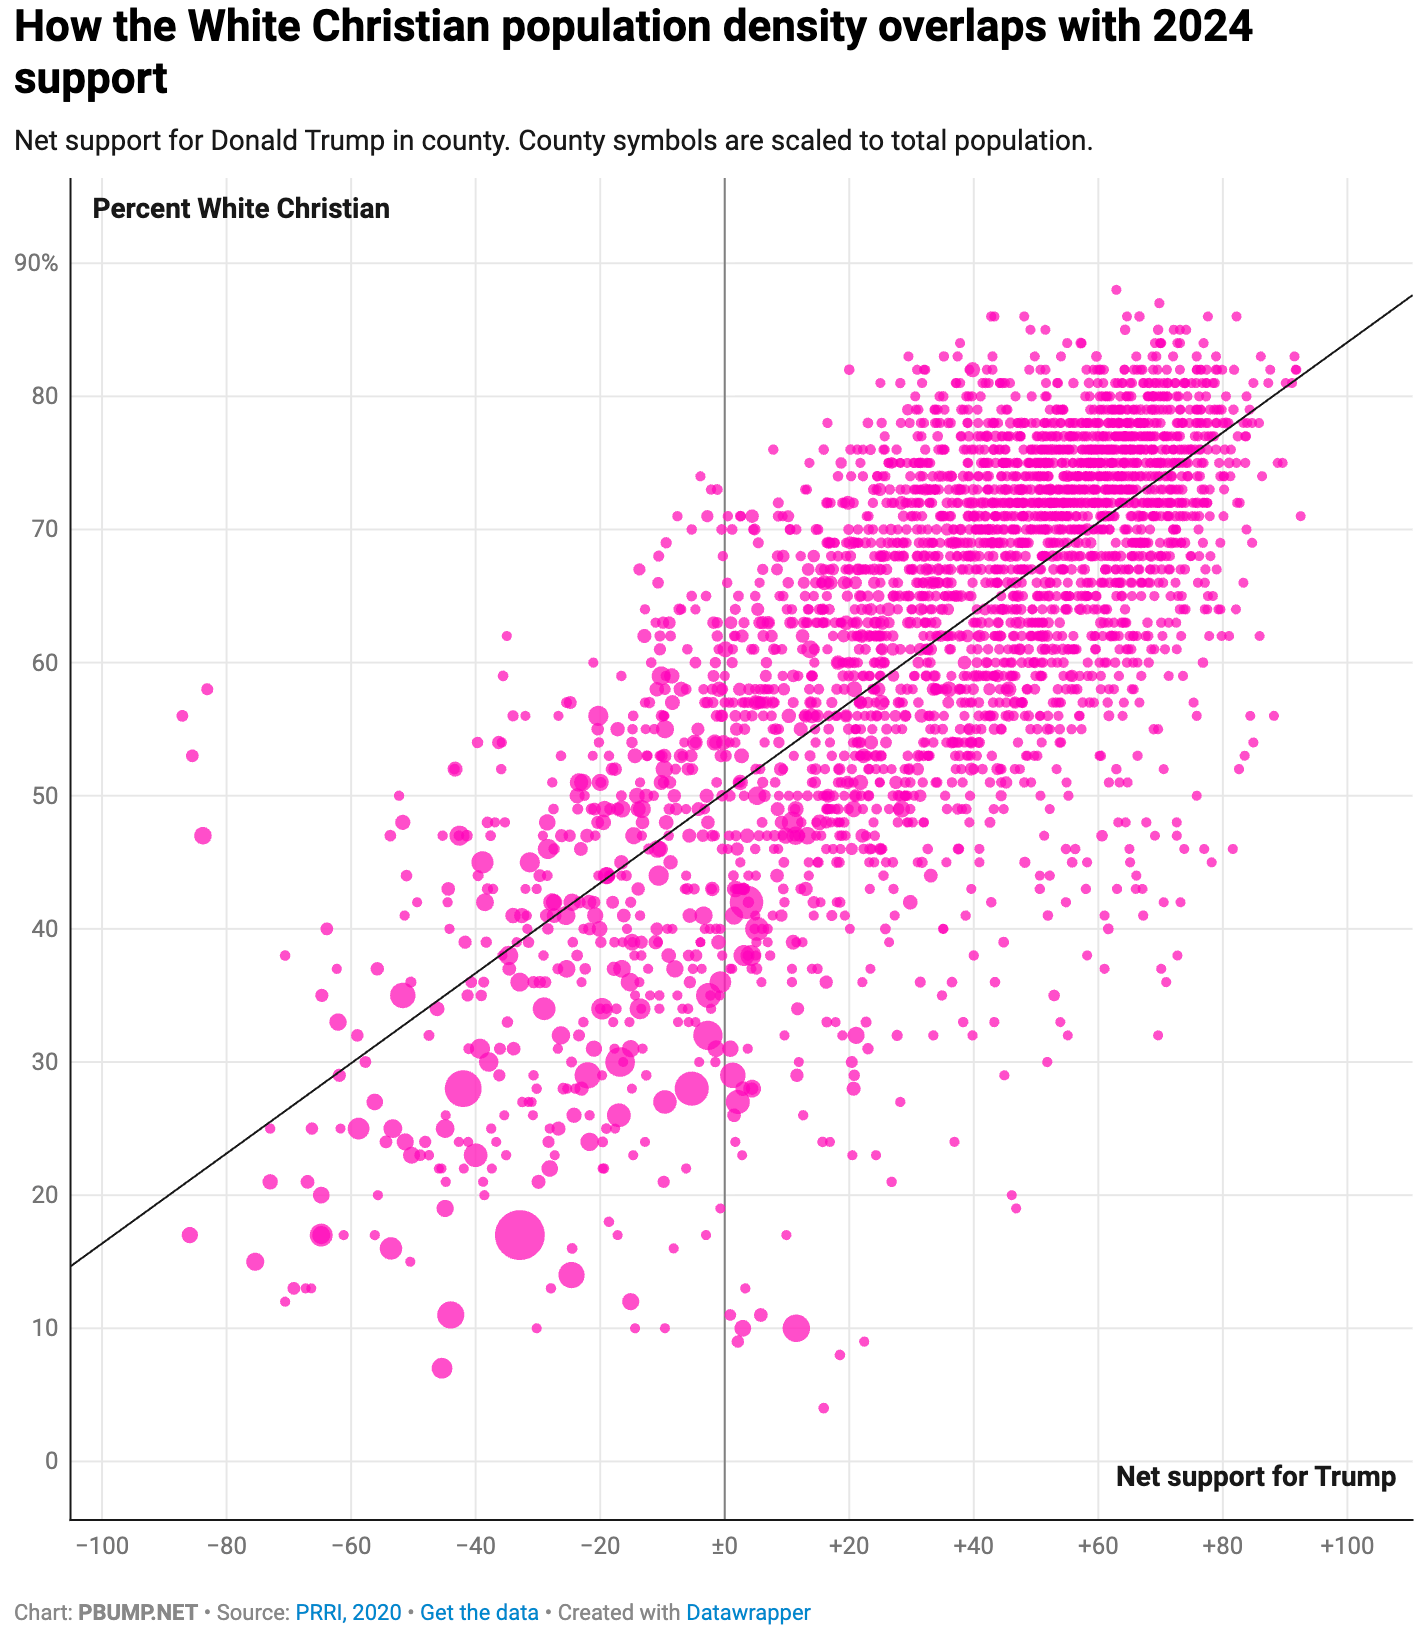
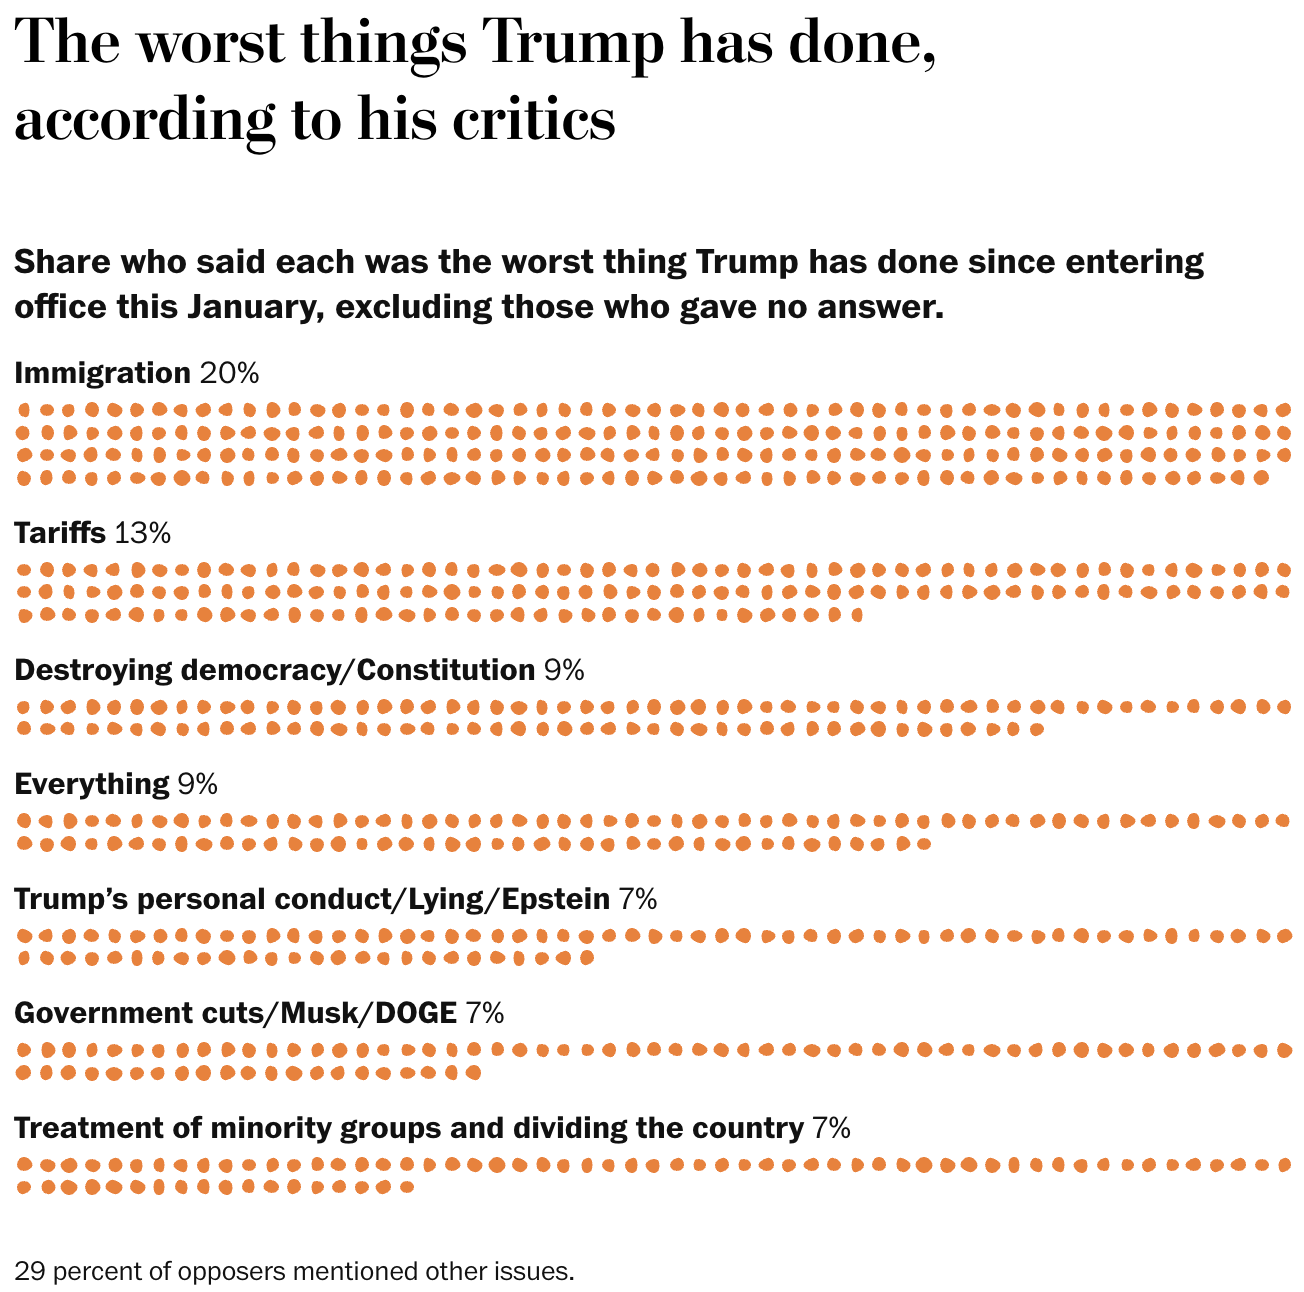
Next, we take a brief look at the United States. Visualizations cover a misleading climate report, visas, and President Trump, from his voters to his actions.
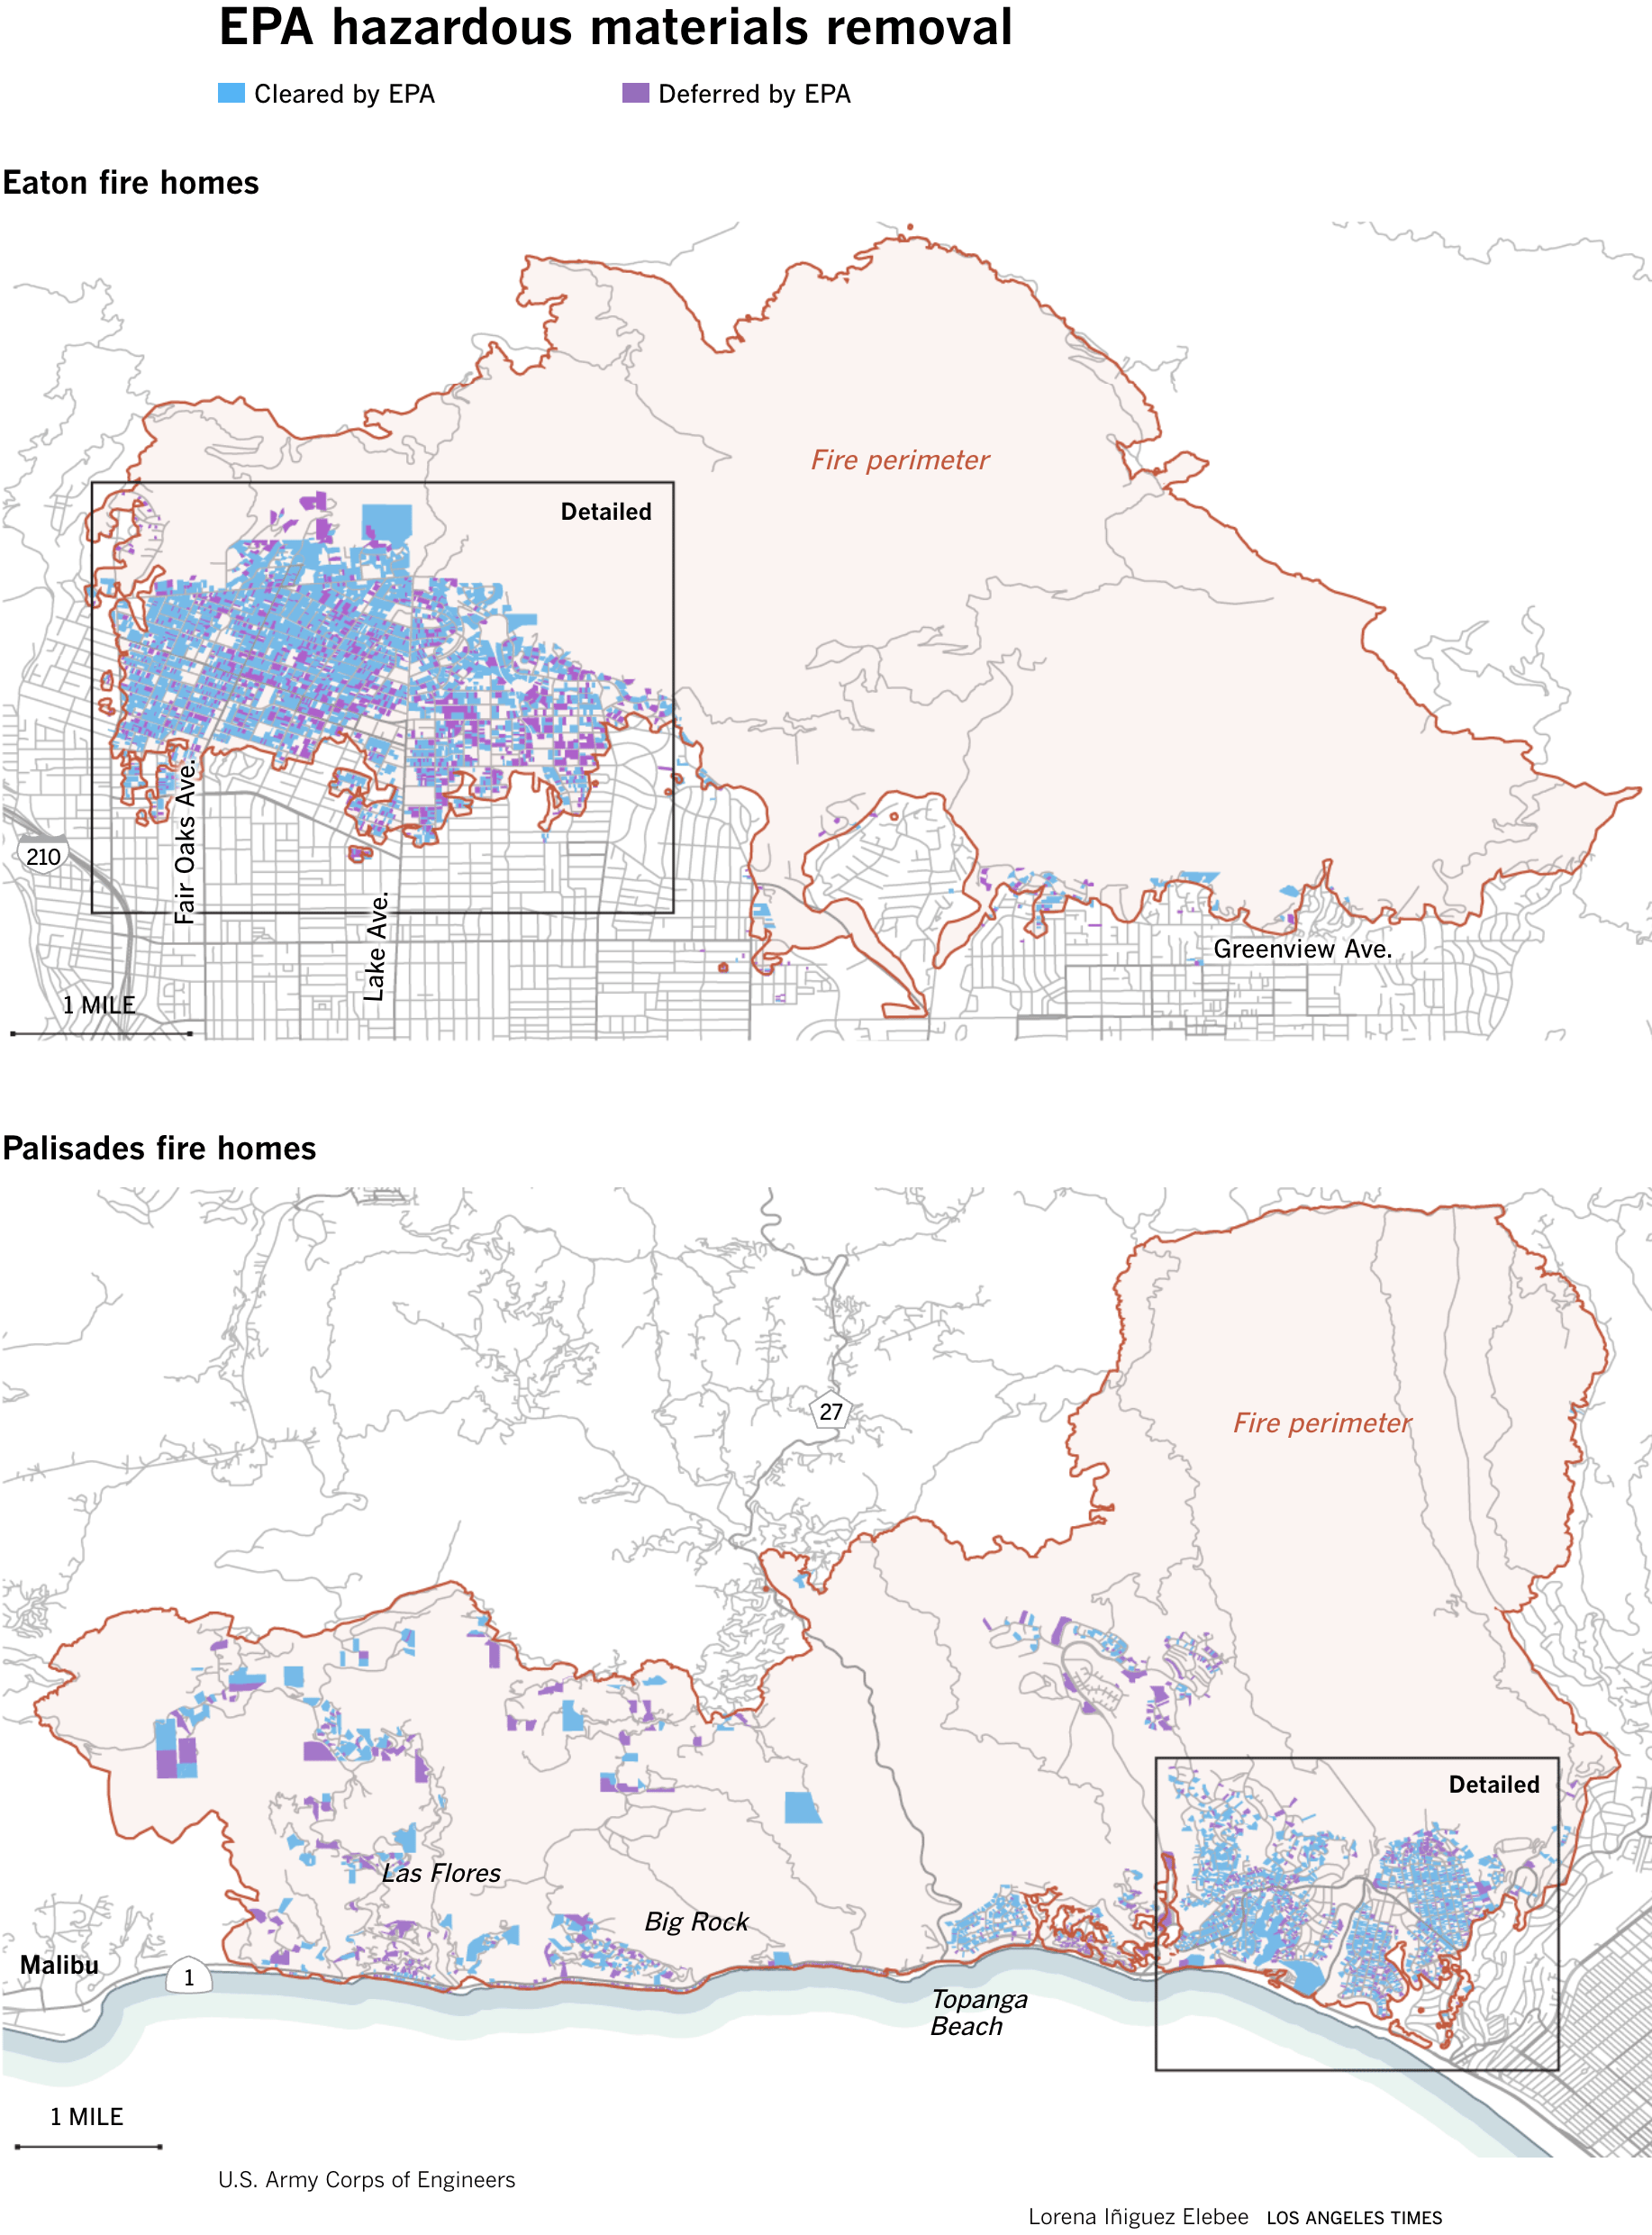
Finally, we zoom in on Los Angeles, where wildfire cleanup wrapped up quickly — and one solar-powered home now supplies electricity to an entire neighborhood.
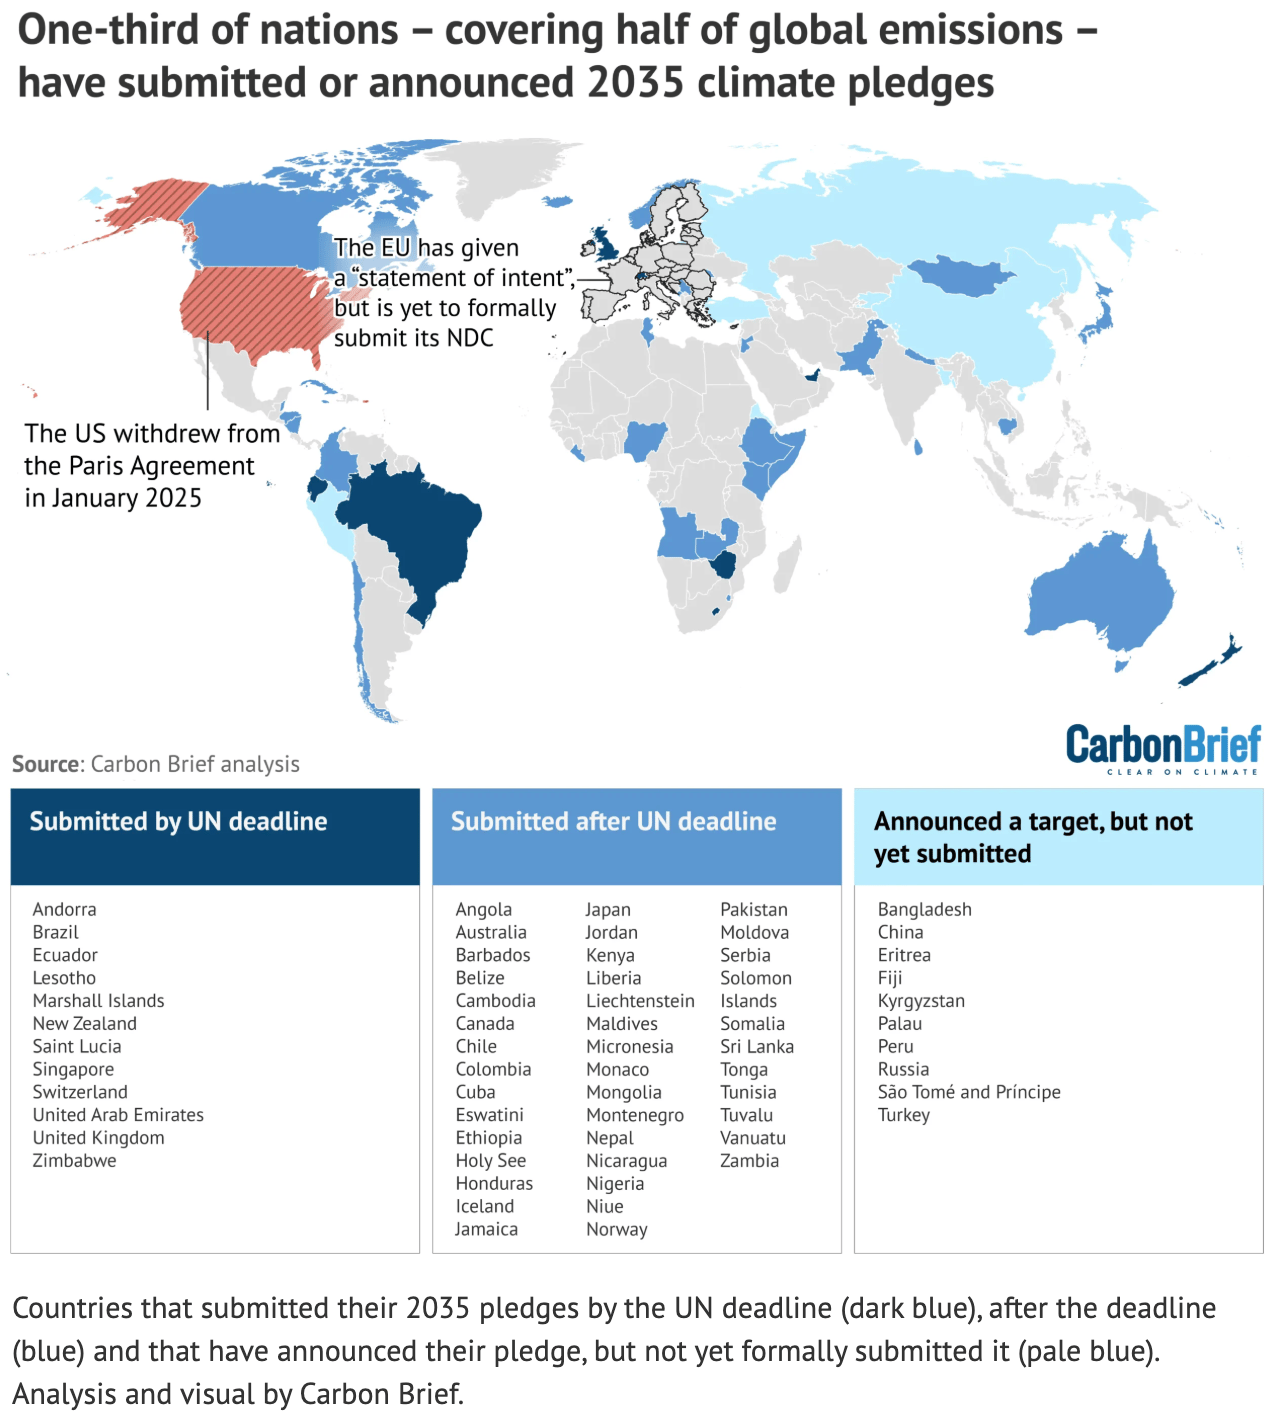
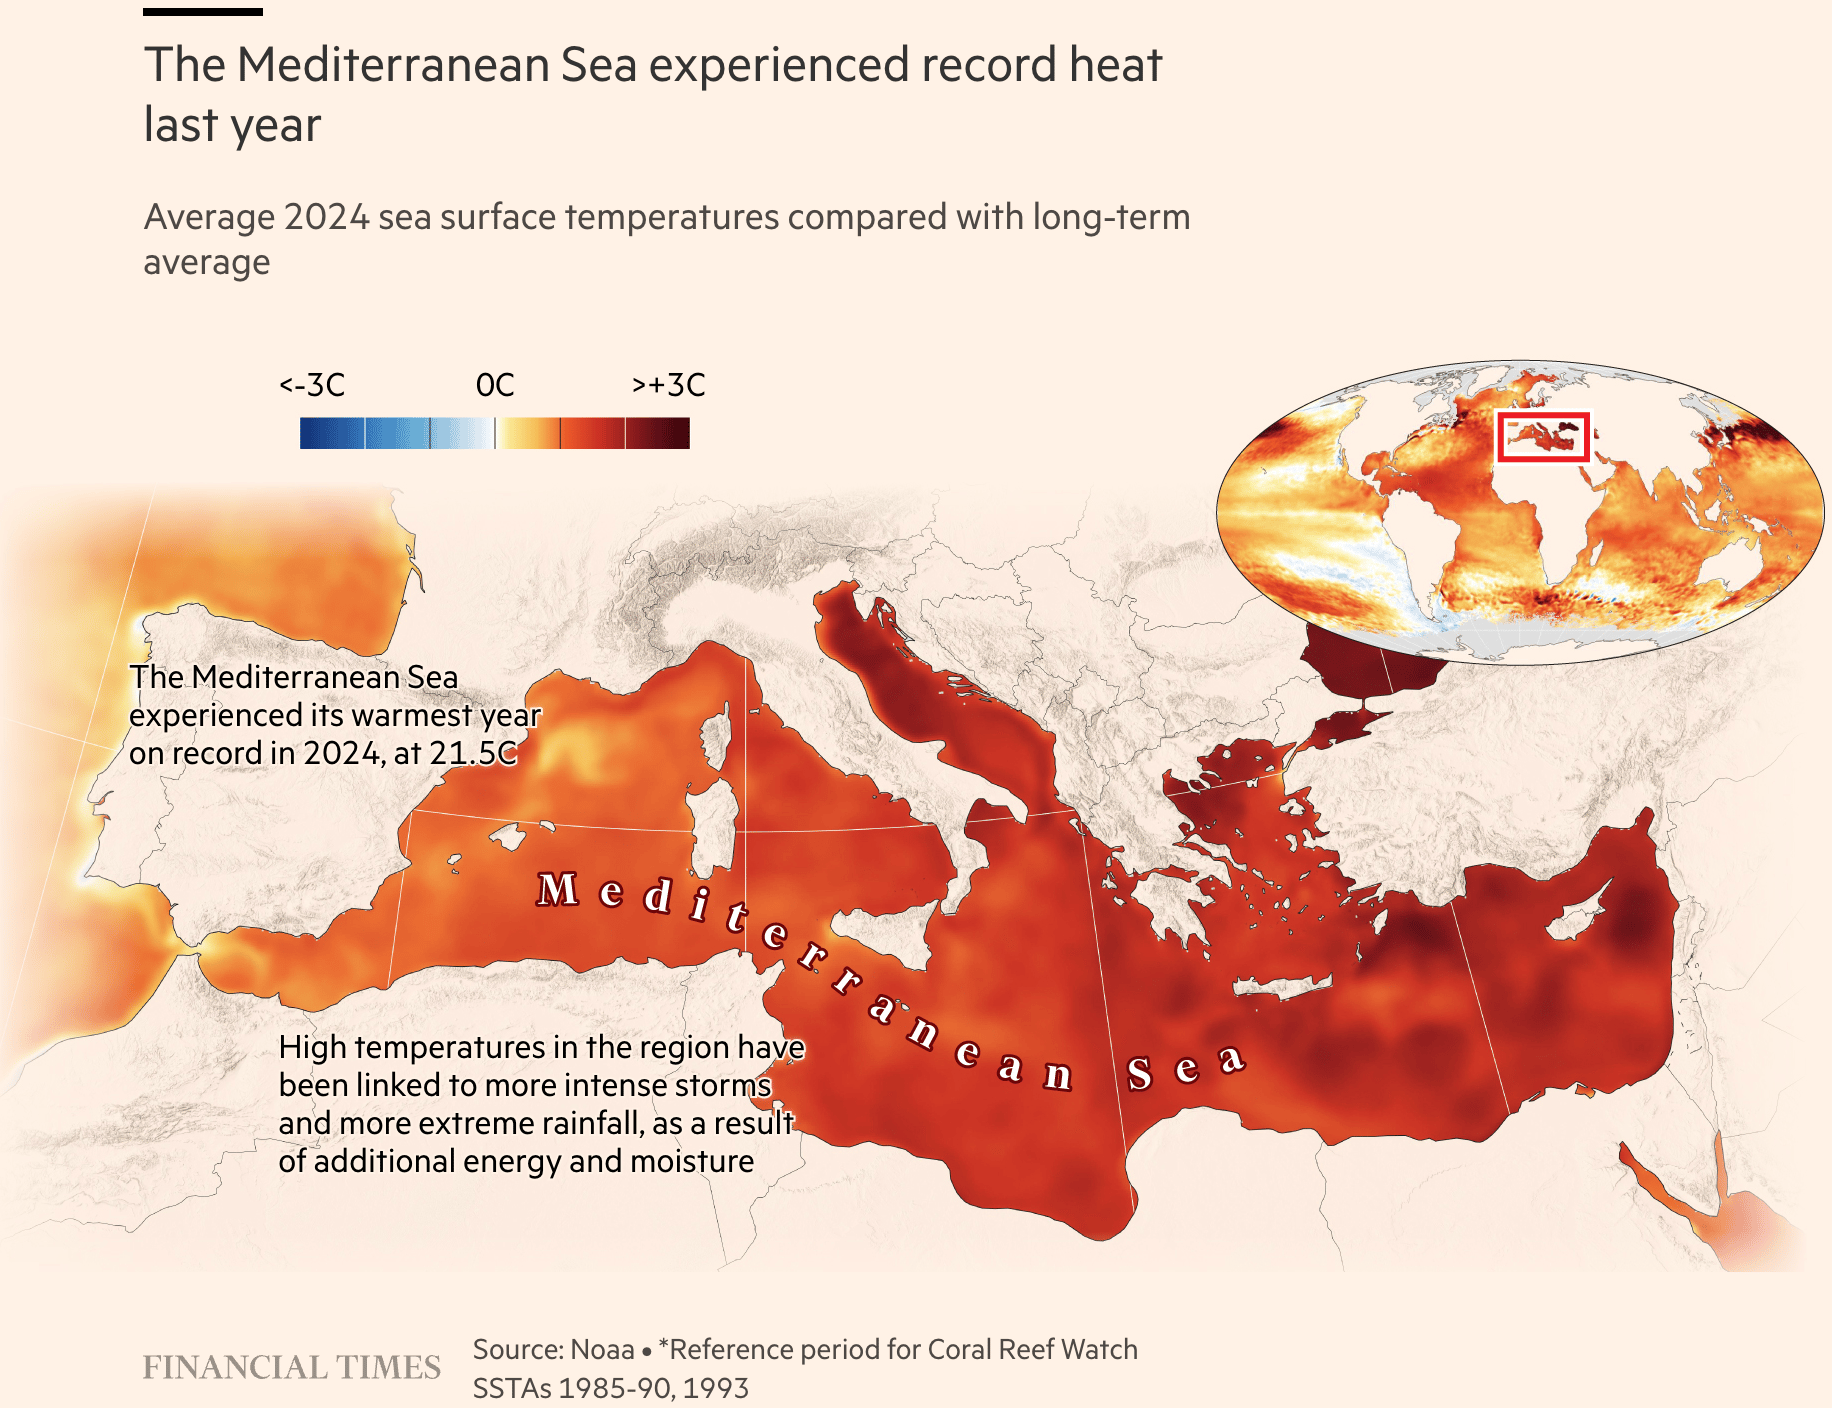
The United Nations’ Climate Summit, held alongside the General Assembly in New York, saw more countries announce their climate pledges for 2035, progress that will be much needed to address issues, such as rising sea temperatures and air pollution.
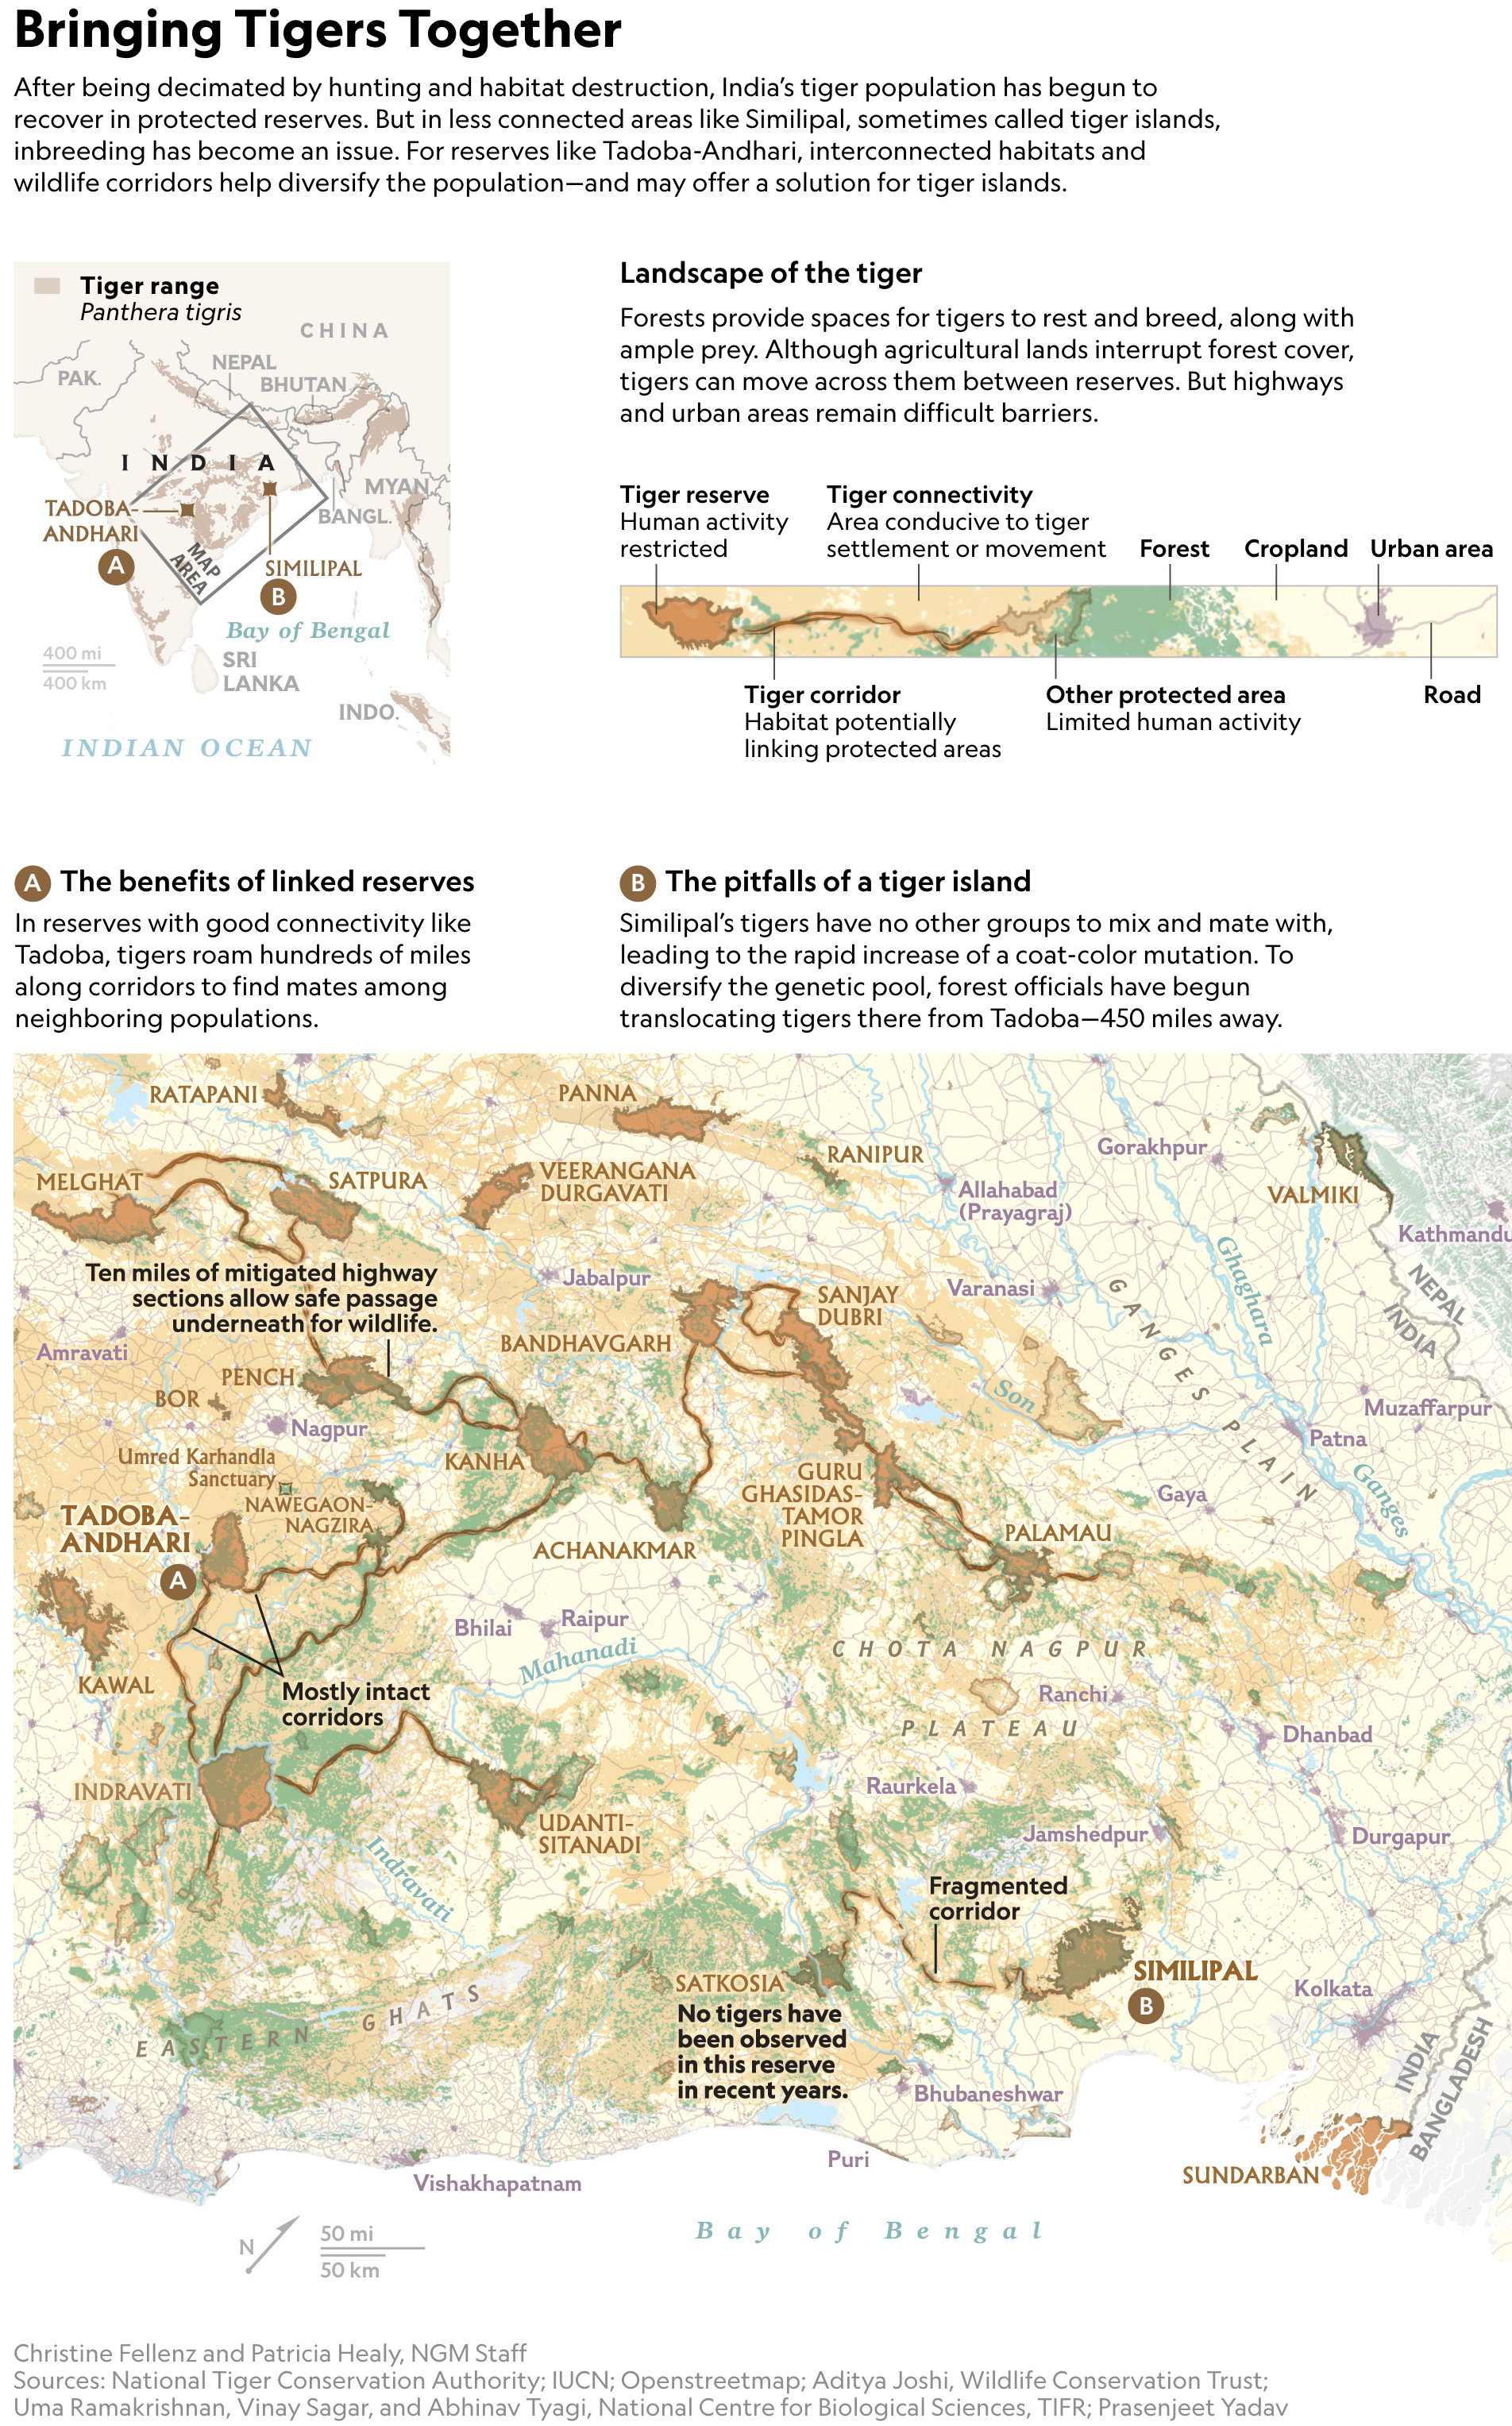
Animals have sneaked into a few visualizations. Learn about tiger habitats in India and the rules of killing wolves in Switzerland.
![SRF: <a href="https://www.srf.ch/news/schweiz/wolf-im-visier-wolf-in-der-schweiz-wann-ist-schiessen-erlaubt"><strong>Wolf im Visier</strong></a><strong> </strong>[<em>Wolf in sight</em>], September 25 <span class="badge">gamified storytelling</span>](https://datawrapper.de/cdn-cgi/image/quality=85,width=1062,f=auto,fit=cover/https://kirby.datawrapper.de/media/pages/blog/data-vis-dispatch-september-30-2025/e0f6a3e2f6-1759219321/cleanshot-2025-09-30-at-10.01.13@2x.png)
Wolves aren’t the only ones faced with their mortality. Europeans are looking into solutions, from treating and avoiding common causes to migration.
![Tagesanzeiger: <a href="https://www.tagesanzeiger.ch/netto-todeszone-europa-schweiz-waechst-gegen-eu-trend-751238240078"><strong>Europa wird zur «Netto-Todeszone»: Wie die Zukunft ohne Zuwanderung aussehen würde</strong></a><strong> </strong>[<em>Europe is becoming a “net death zone”: What the future would look like without immigration</em>], September 23](https://datawrapper.de/cdn-cgi/image/quality=85,width=2050,f=auto,fit=cover/https://kirby.datawrapper.de/media/pages/blog/data-vis-dispatch-september-30-2025/6aaadddc8d-1759176854/cleanshot-2025-09-29-at-22.13.04@2x.png)
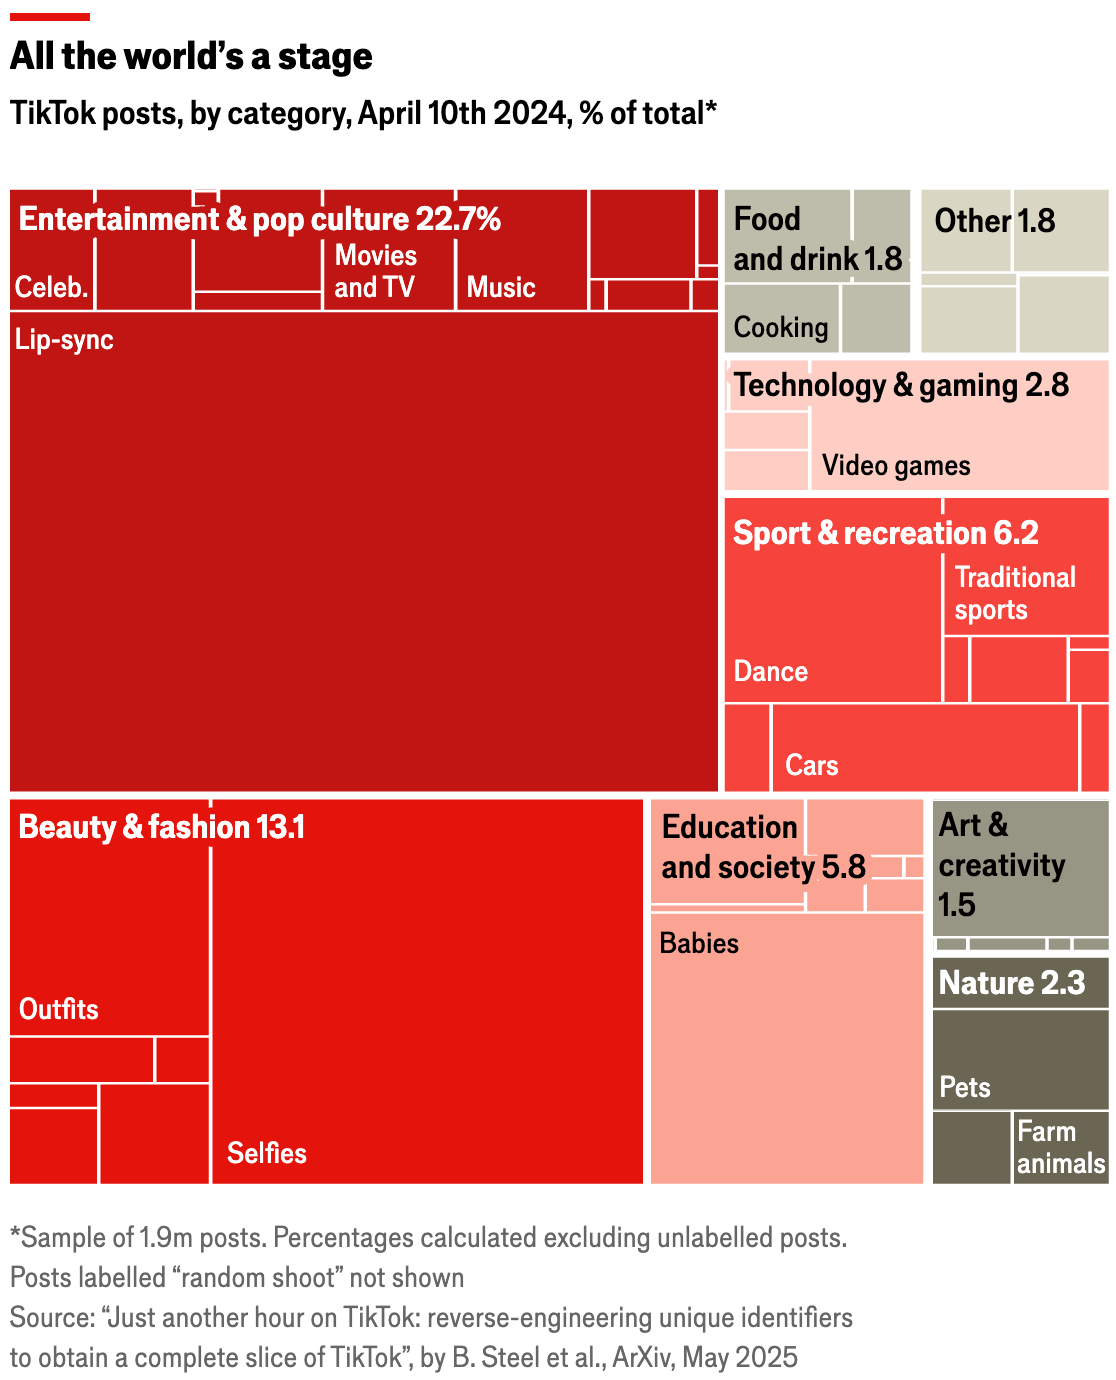
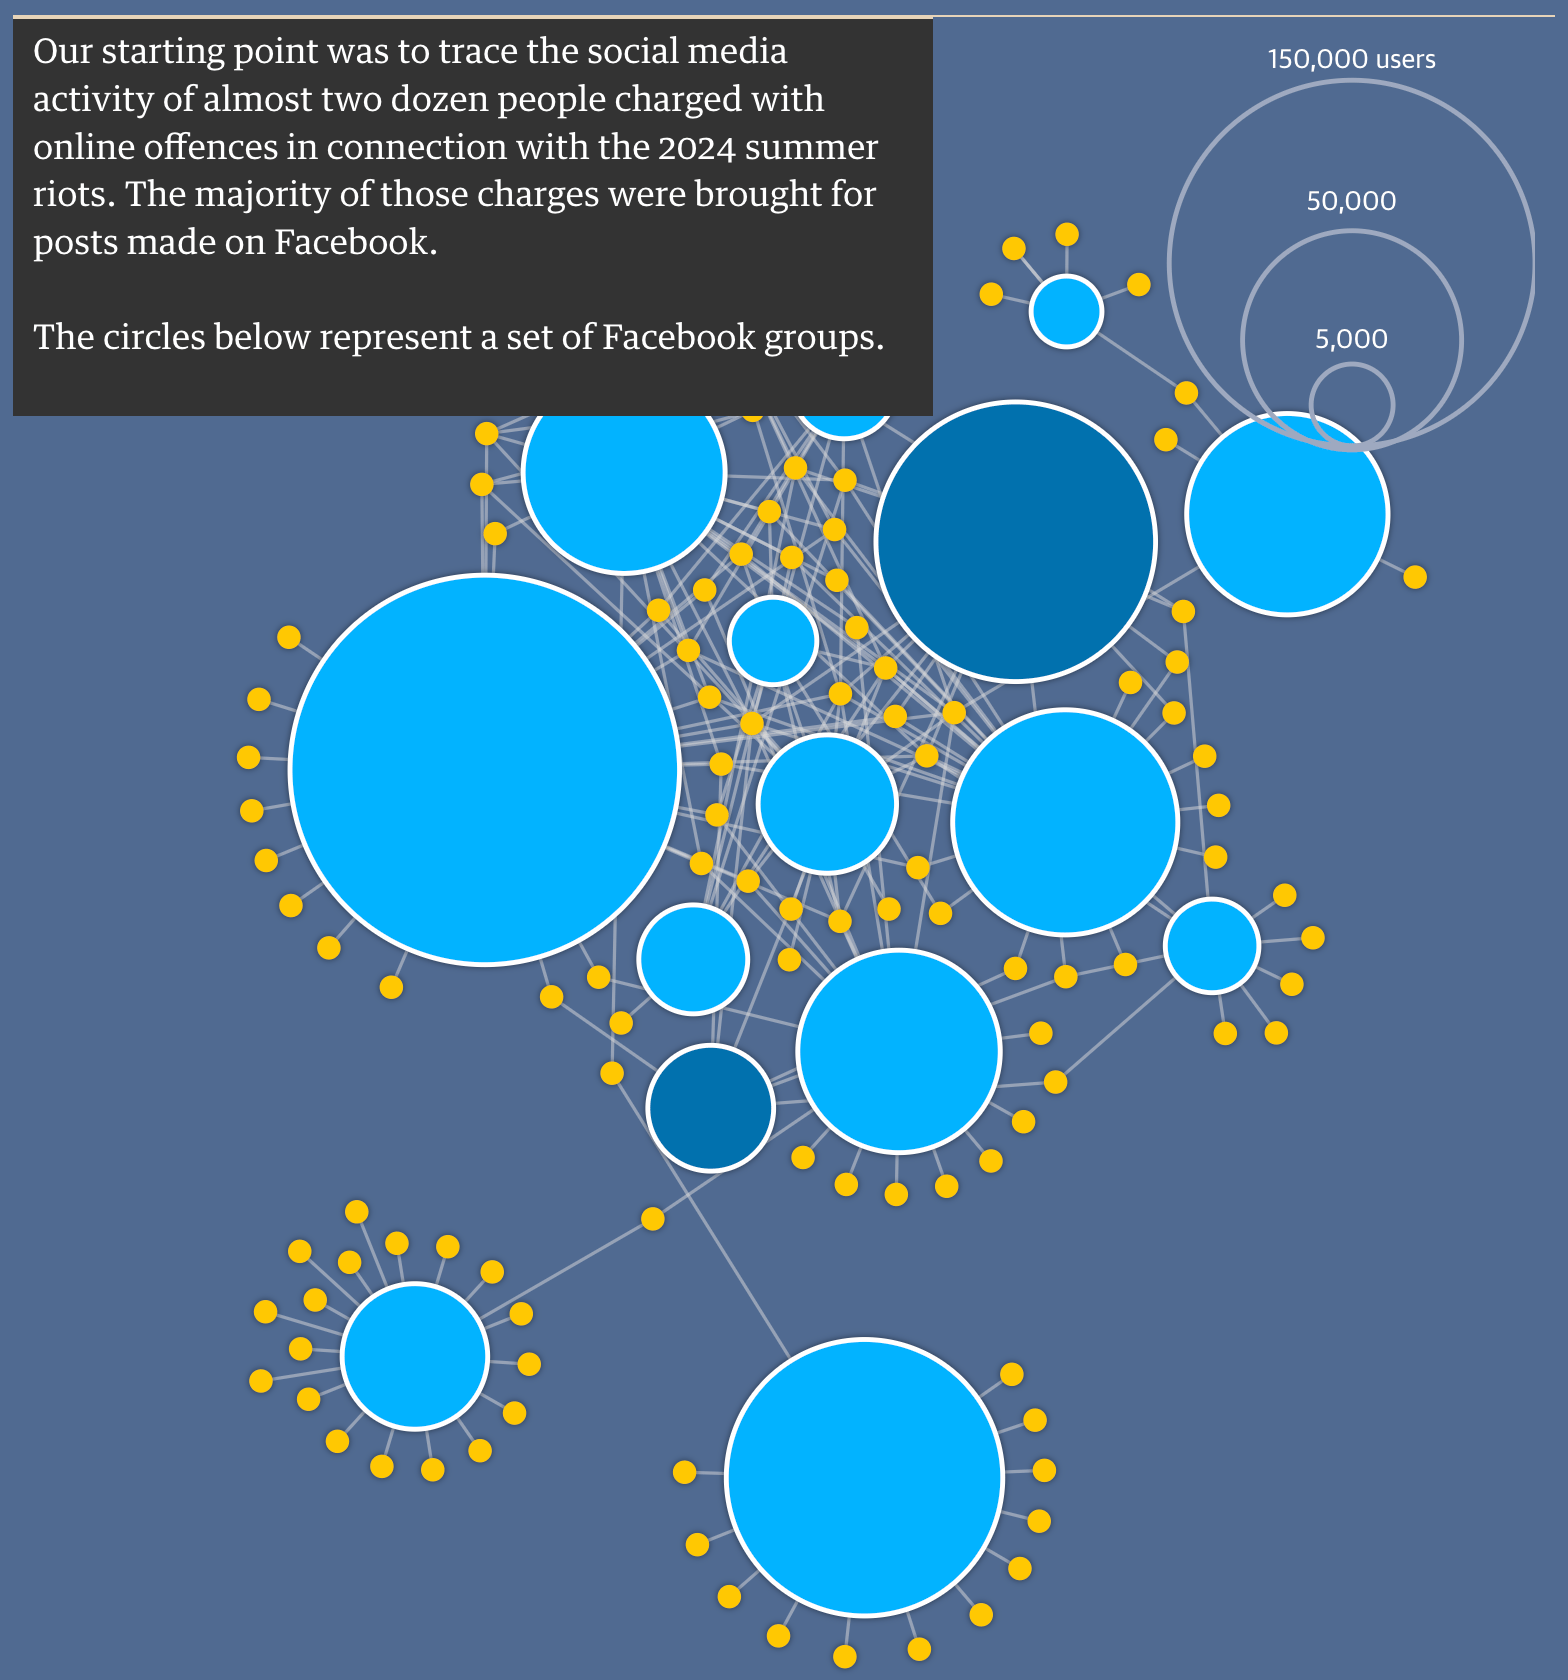
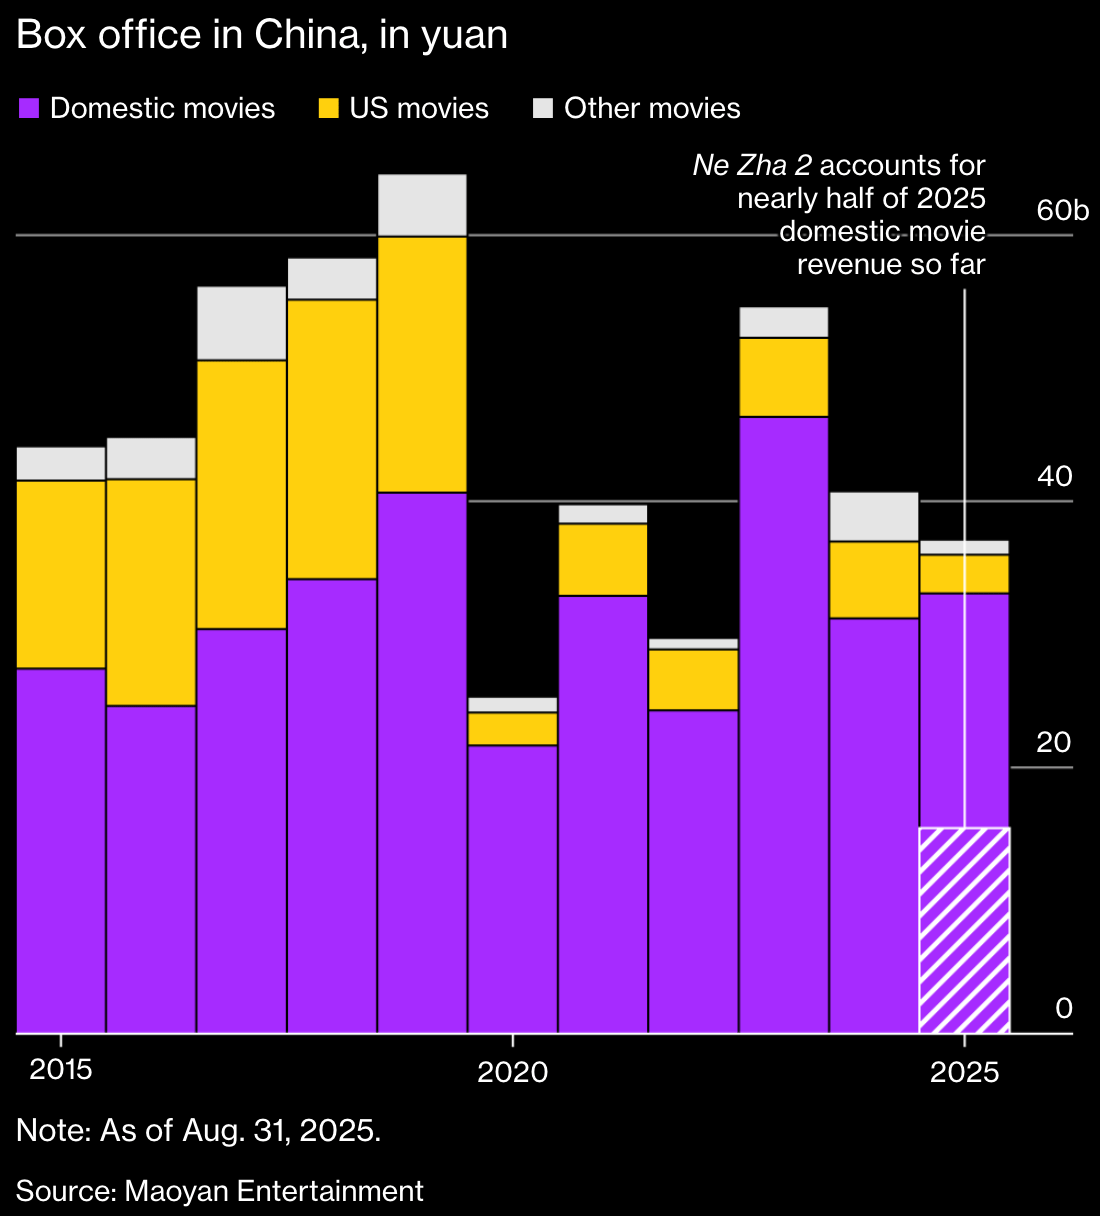
Movies and social media play a major role in our personal lives. TikTok is full of lip-syncing and baby videos, Facebook allows far-right ideas to flourish, and Chinese movies perform particularly well at home.
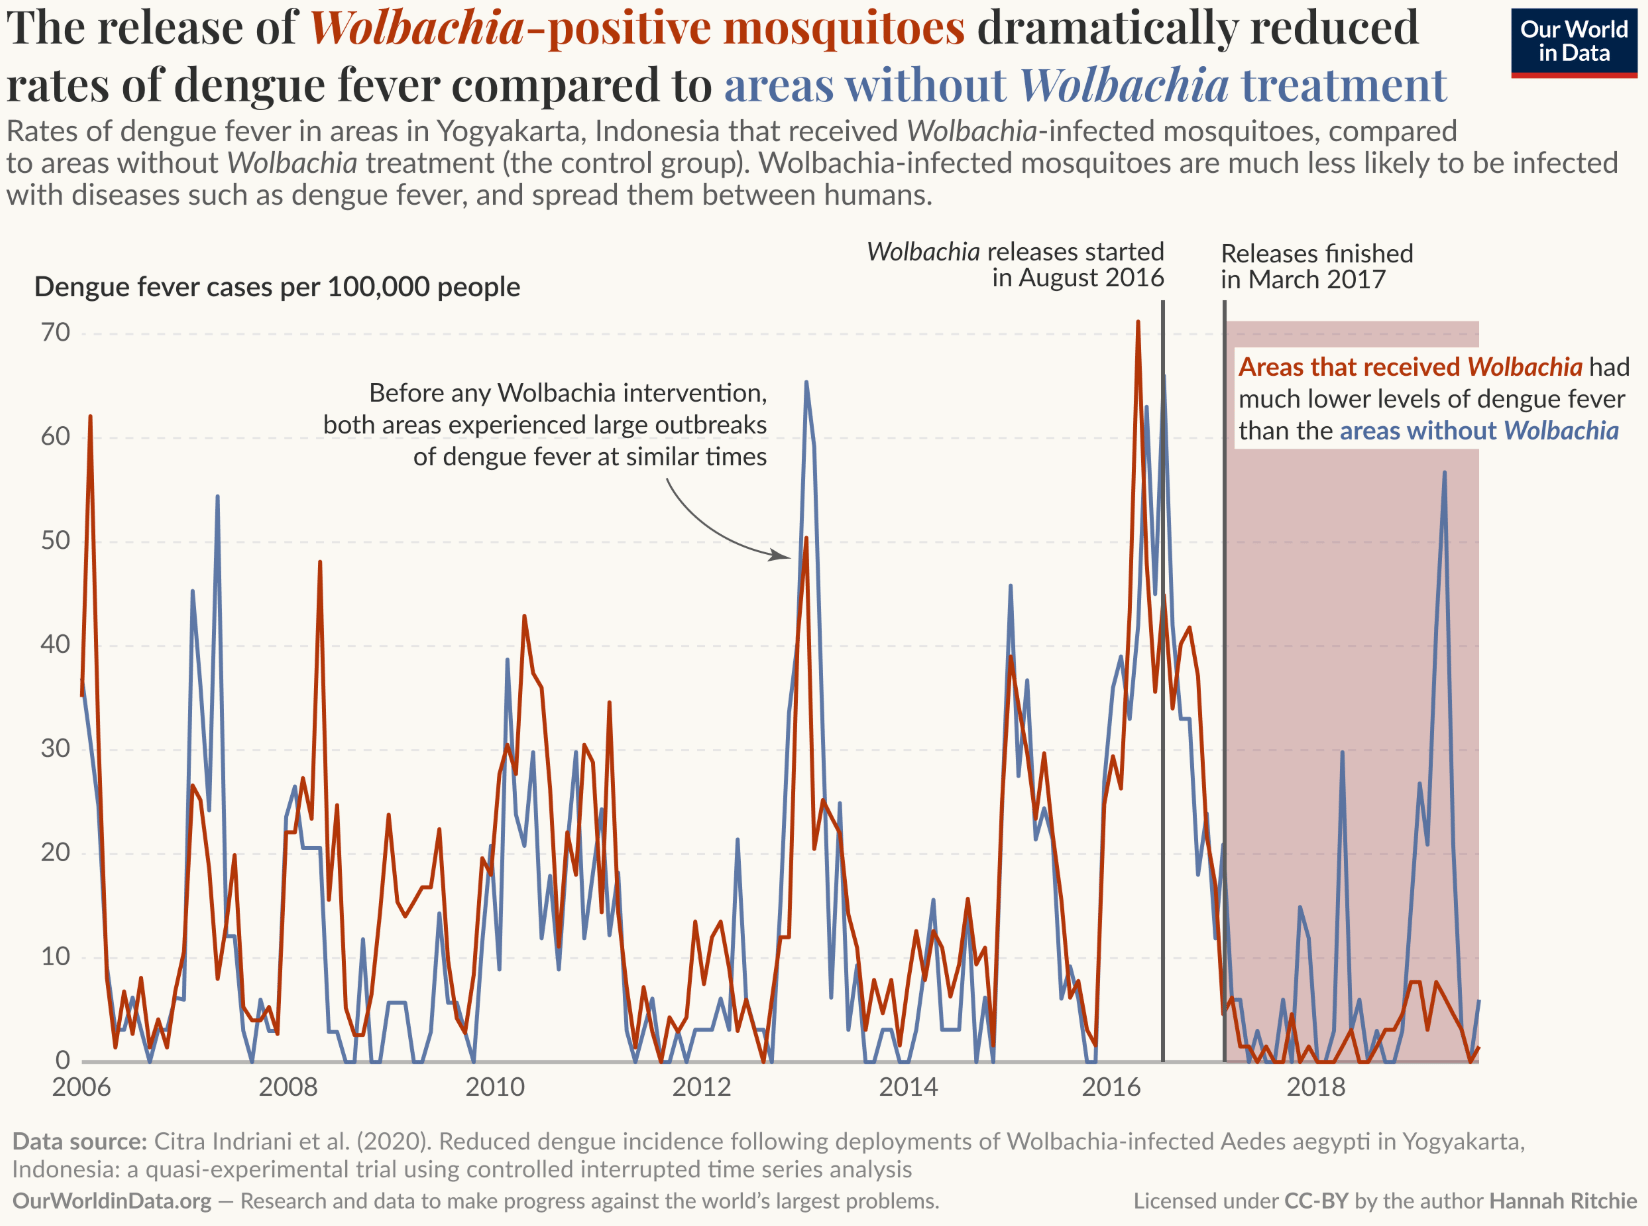
Red lines in charts effectively illustrate a variety of issues. They can show the development of traffic jams in Switzerland, the use of mosquitoes to reduce dengue fever, as well as drug and alcohol misuse.
![Tagesanzeiger: <a href="https://www.tagesanzeiger.ch/10-millionen-initiative-wie-zuwanderung-die-schweiz-veraendert-978445615512"><strong>10-Millionen-Schweiz: Das sind die Folgen bei Jobs, Mieten und Kriminalität</strong></a><strong> </strong>[<em>10 million Swiss: The consequences for jobs, rents, and crime</em>], September 25](https://datawrapper.de/cdn-cgi/image/quality=85,width=1630,f=auto,fit=cover/https://kirby.datawrapper.de/media/pages/blog/data-vis-dispatch-september-30-2025/1e7181f99a-1759159396/cleanshot-2025-09-29-at-17.22.17@2x.png)
![Colin Angus: "Last chart for now - an update to this comparison of age trends in drug and alcohol deaths in Scotland [...]," September 23 (<a href="https://bsky.app/profile/victimofmaths.bsky.social/post/3lzitgkmyj22t"><strong>Bluesky</strong></a>)](https://datawrapper.de/cdn-cgi/image/quality=85,width=2000,f=auto,fit=cover/https://kirby.datawrapper.de/media/pages/blog/data-vis-dispatch-september-30-2025/0ee8958d15-1759223261/bafkreibvmqwssbzfldchx5y7arii7ayfci23qnp6hb3kuge67wc2wlxbgm.jpg)
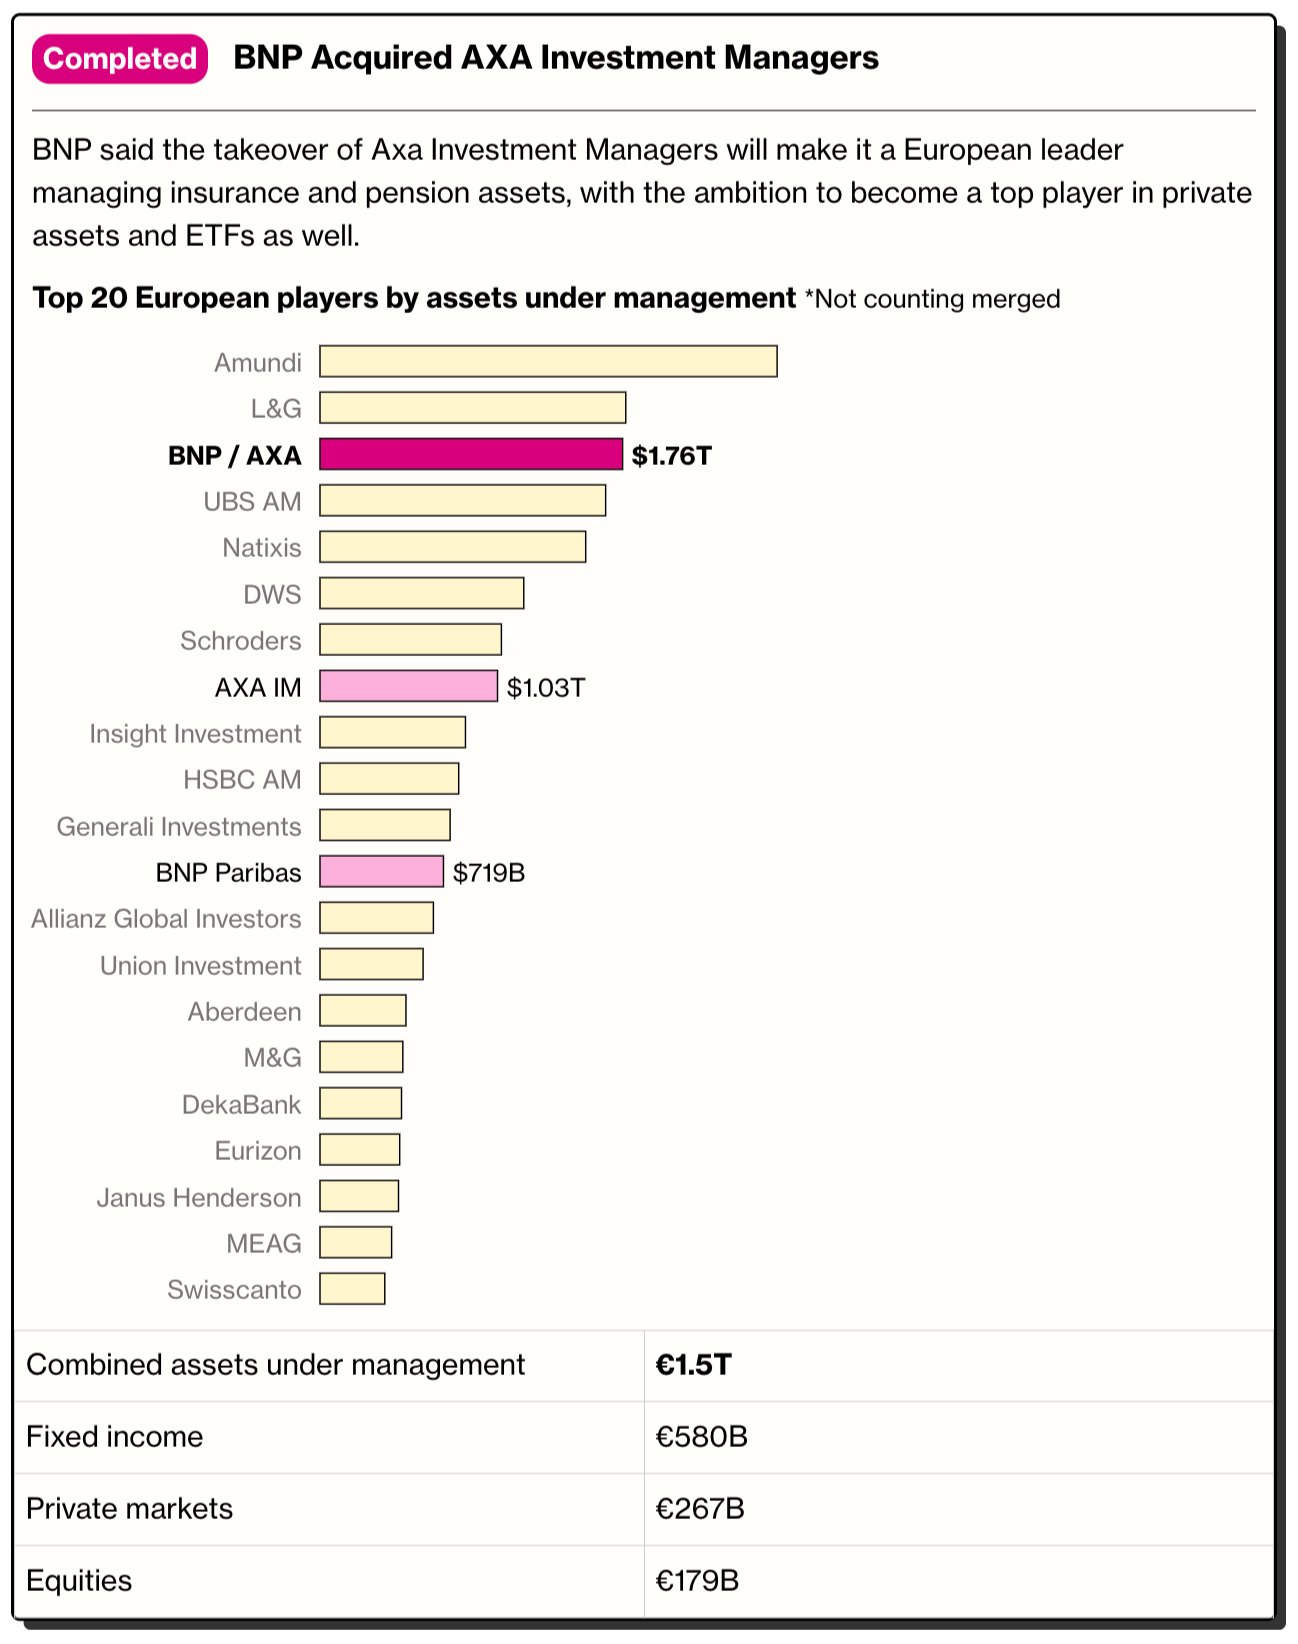
Drumroll for the final section, which is diverse as ever, covering noise pollution, the low Earth orbit, job satisfaction, and Europe’s asset managers.
![Die Zeit: <a href="https://www.zeit.de/arbeit/2025-09/zufriedenheit-job-berufswahl-arbeitgeber-job-crafting"><strong>Wie gut passt mein Job zu mir?</strong></a> [<em>How well does my job suit me?</em>], September 26](https://datawrapper.de/cdn-cgi/image/quality=85,width=1296,f=auto,fit=cover/https://kirby.datawrapper.de/media/pages/blog/data-vis-dispatch-september-30-2025/9bc17a394c-1759224180/cleanshot-2025-09-30-at-11.22.28@2x.png)
What else we found interesting


Applications are open for…
A researcher in data visualization atCity St George’s, University of London


