New in locator maps: Pattern fills


We’re happy to announce a new feature for our Datawrapper locator maps: You can now fill your area markers with pattern (stripes). This feature is available for everyone, including users on a free plan. Here’s how it works:
How to fill your area markers with pattern
To create pattern fills, you first need an area. Import it as a GeoJSON or simply use the Add region as area marker feature in our locator map.
Now select your area marker in the marker list. You’ll find the new pattern options directly in the Fill settings:

If you select a pattern, you can adjust line width (how thick do you want your stripes?) and line gap (how dense should the lines be?). Simply play around with the settings until you get to a pattern you like.
If you’re using our PDF export – which is part of our Custom or Enterprise plan –, pattern fills will be exported as vector paths and shaped by clipping masks. That means you can change both the pattern (color, rotation, etc.) and the area in software like Adobe Illustrator.
When to use pattern
Like the recently launched shaded relief, vignettes and the option to add regions as area markers, we hope that pattern fills allow you to build better maps. Here are some ideas for when to use them:
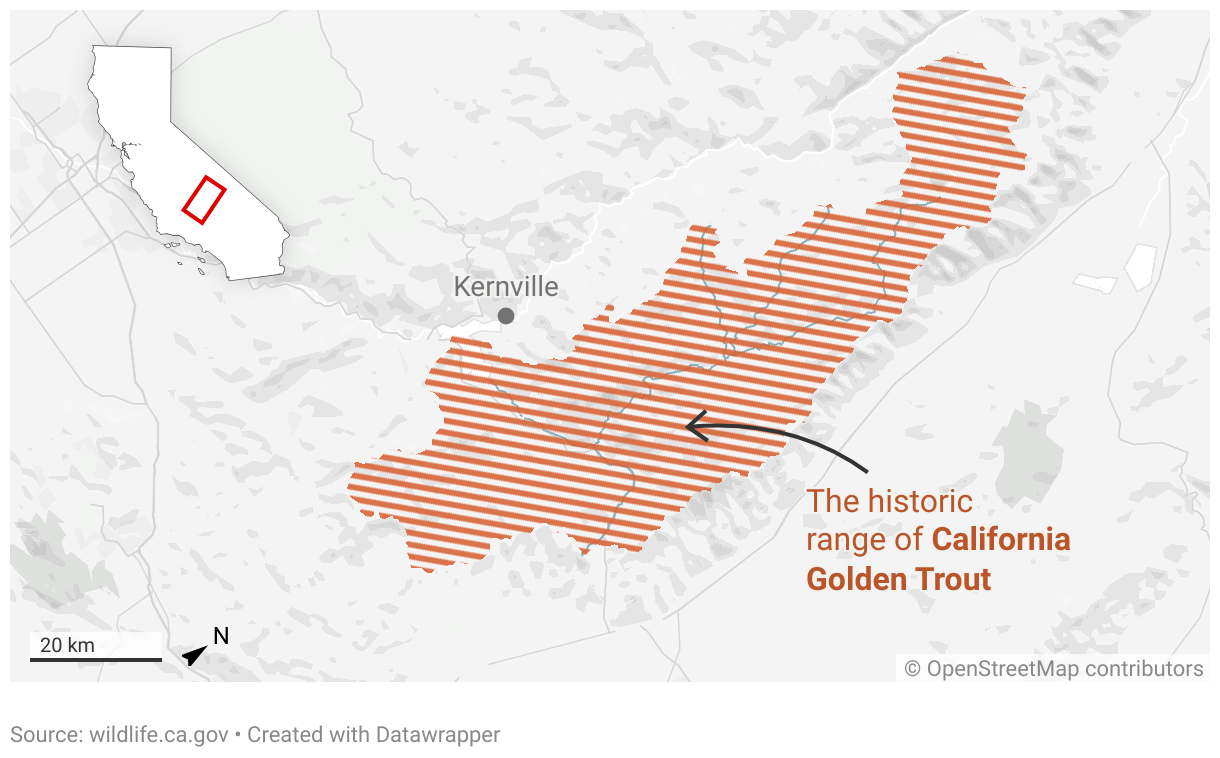
Uncertain areas
Use striped areas when things are not certain or changing a lot, e.g. to report on conflict zones or to show the distribution of animal or plant species.
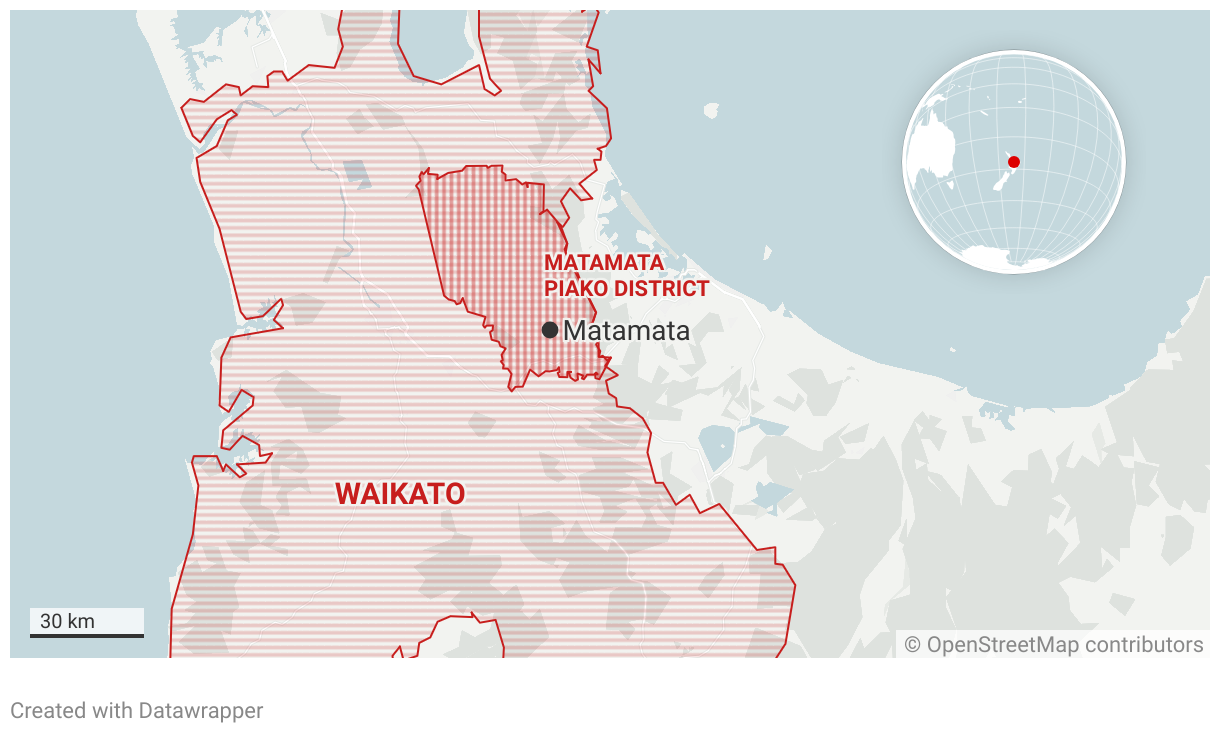
Nested areas
Sometimes you might want to show an administrative situation: How a town is part of a province is part of a state is part of a country. So far, you could give your areas different opacities to do so – now you have something new in your toolbox:
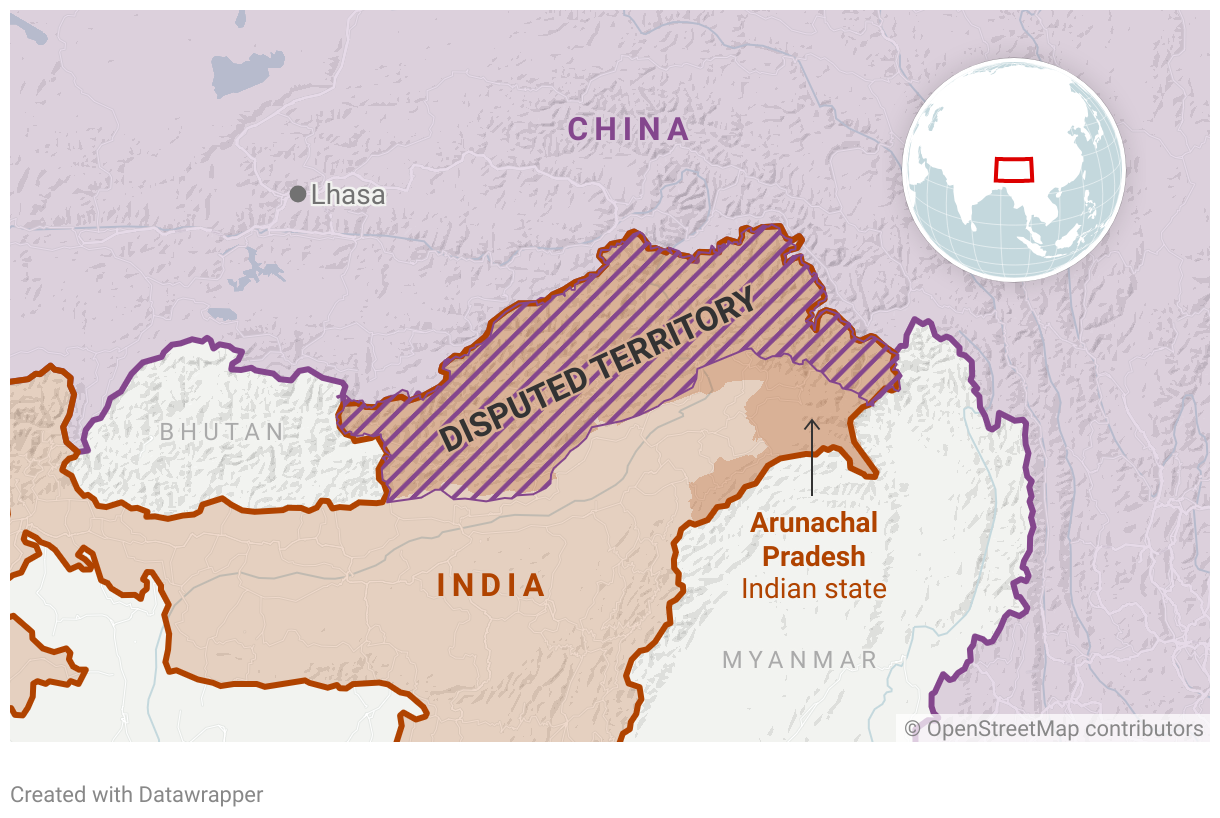
Overlapping areas
If the administrative situation is everything but clear, you’re probably dealing with disputed territories. Pattern fills are a great way to deal with them on your maps. Here we use the stripes to show a disputed territory between China and India:
To get started, create a locator map here (no need to sign up). You can also hover over one of the maps above and select “Edit this chart” in the top right corner to get placed right into the map creation process.
We hope this feature will help you create even nicer-looking maps. Feedback, questions, hints? Write to us at support@datawrapper.de. We’re always happy to hear from you.


