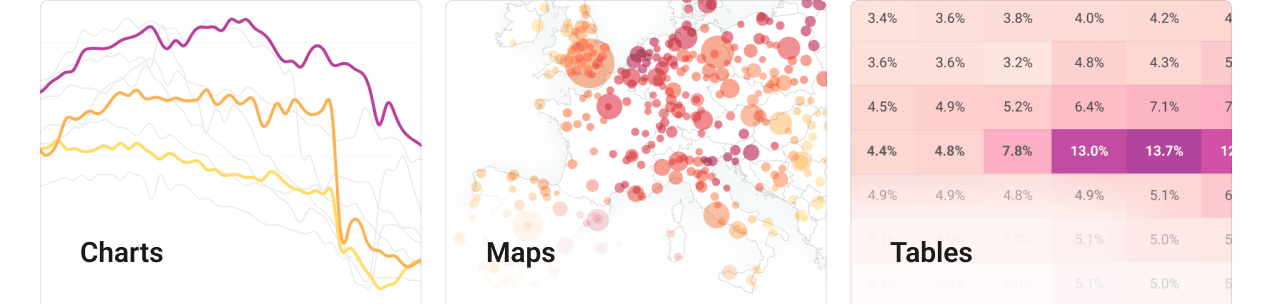
Create specialized visualizations with the Business plan
Add two purpose-built visualization types for powerful financial visualizations to your Datawrapper toolkit.
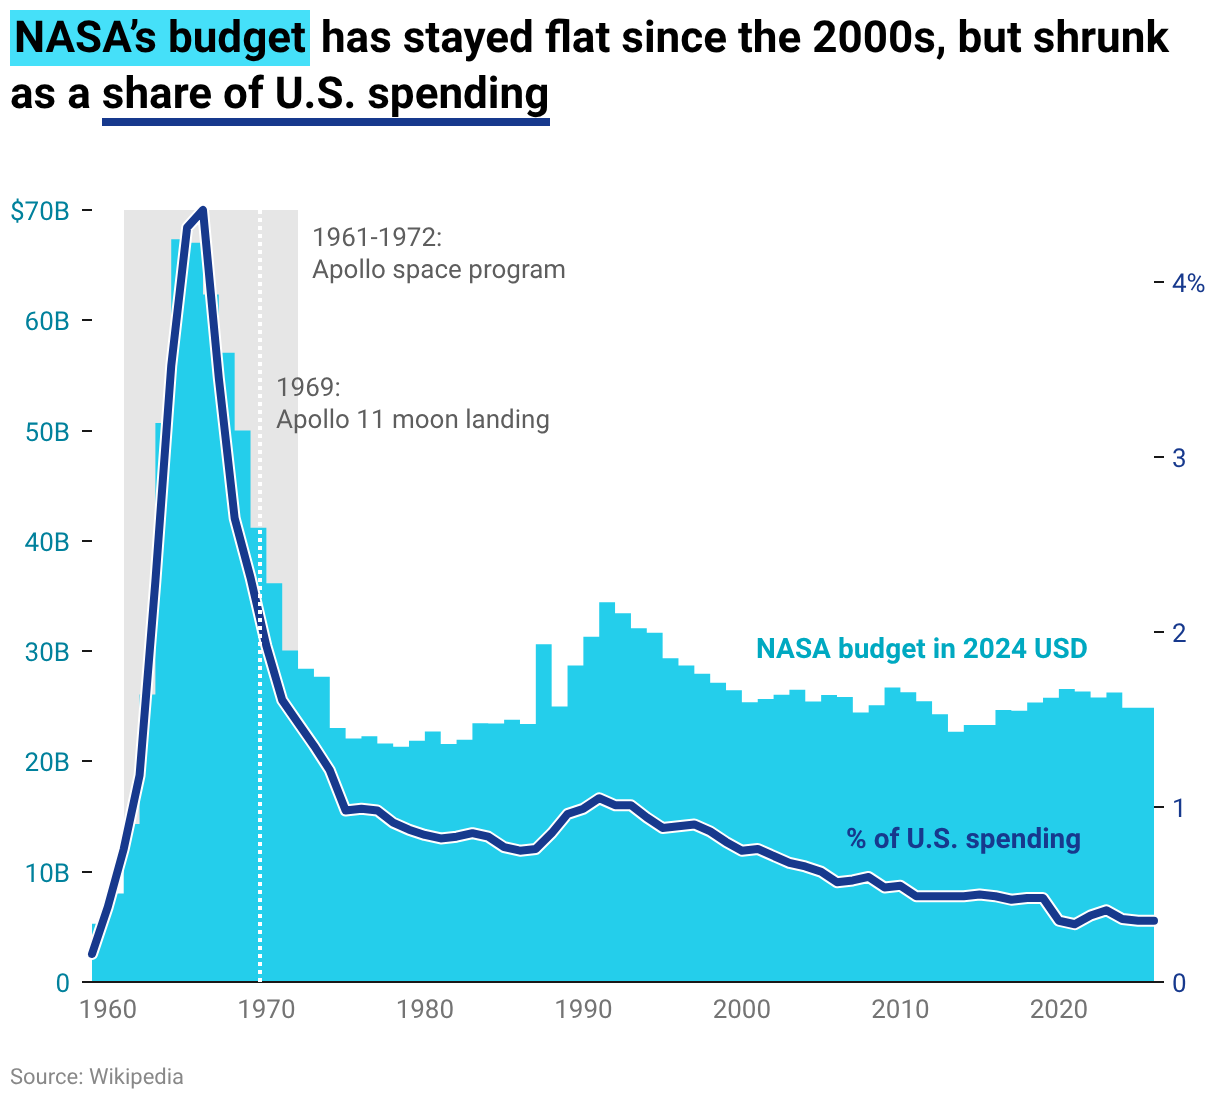
Dual-axis charts 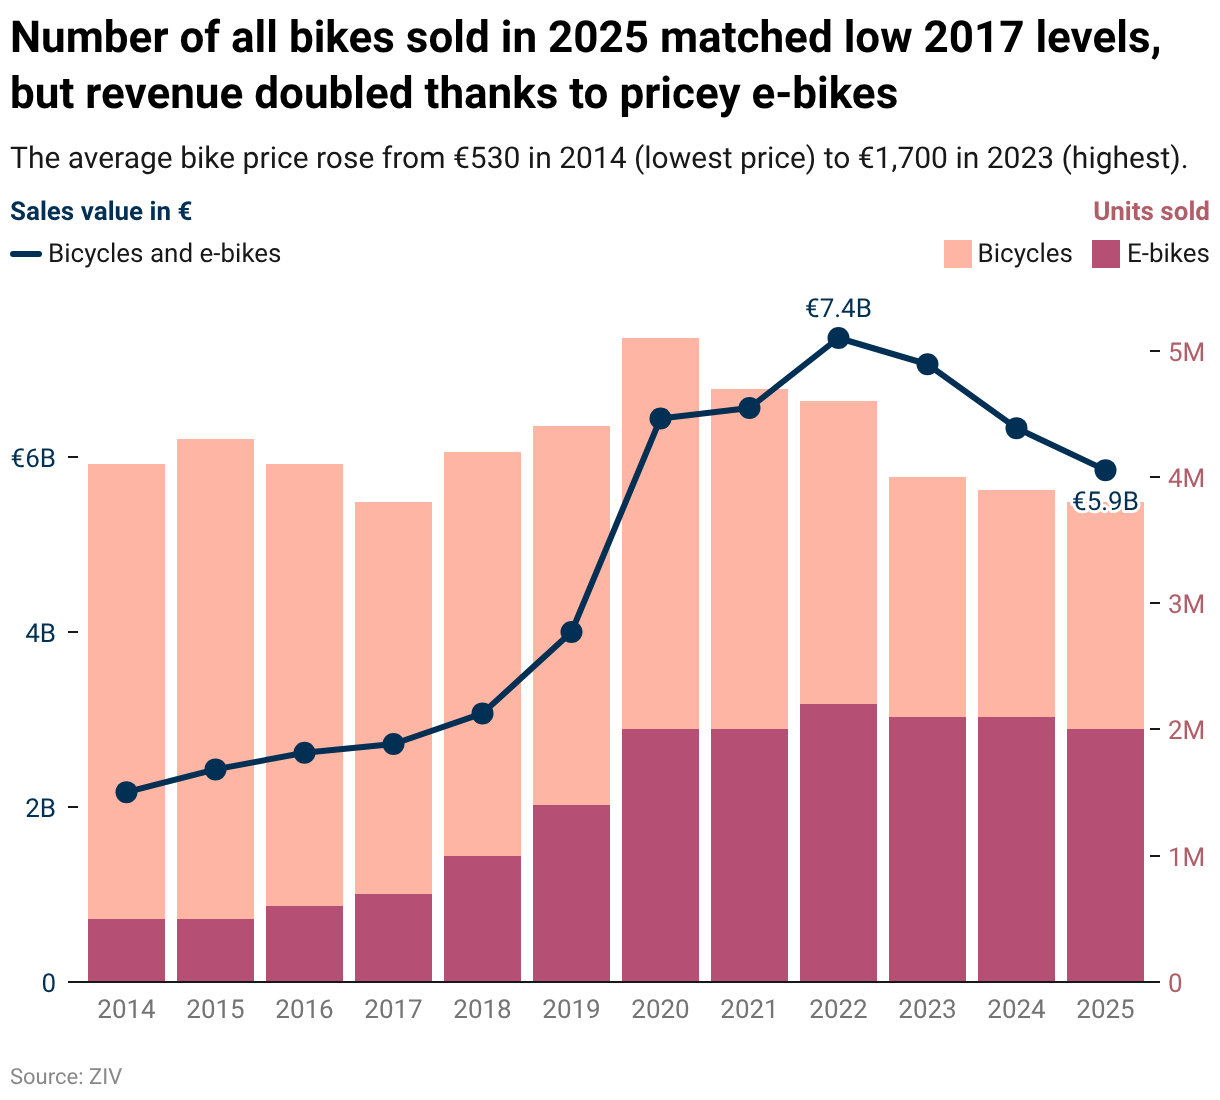
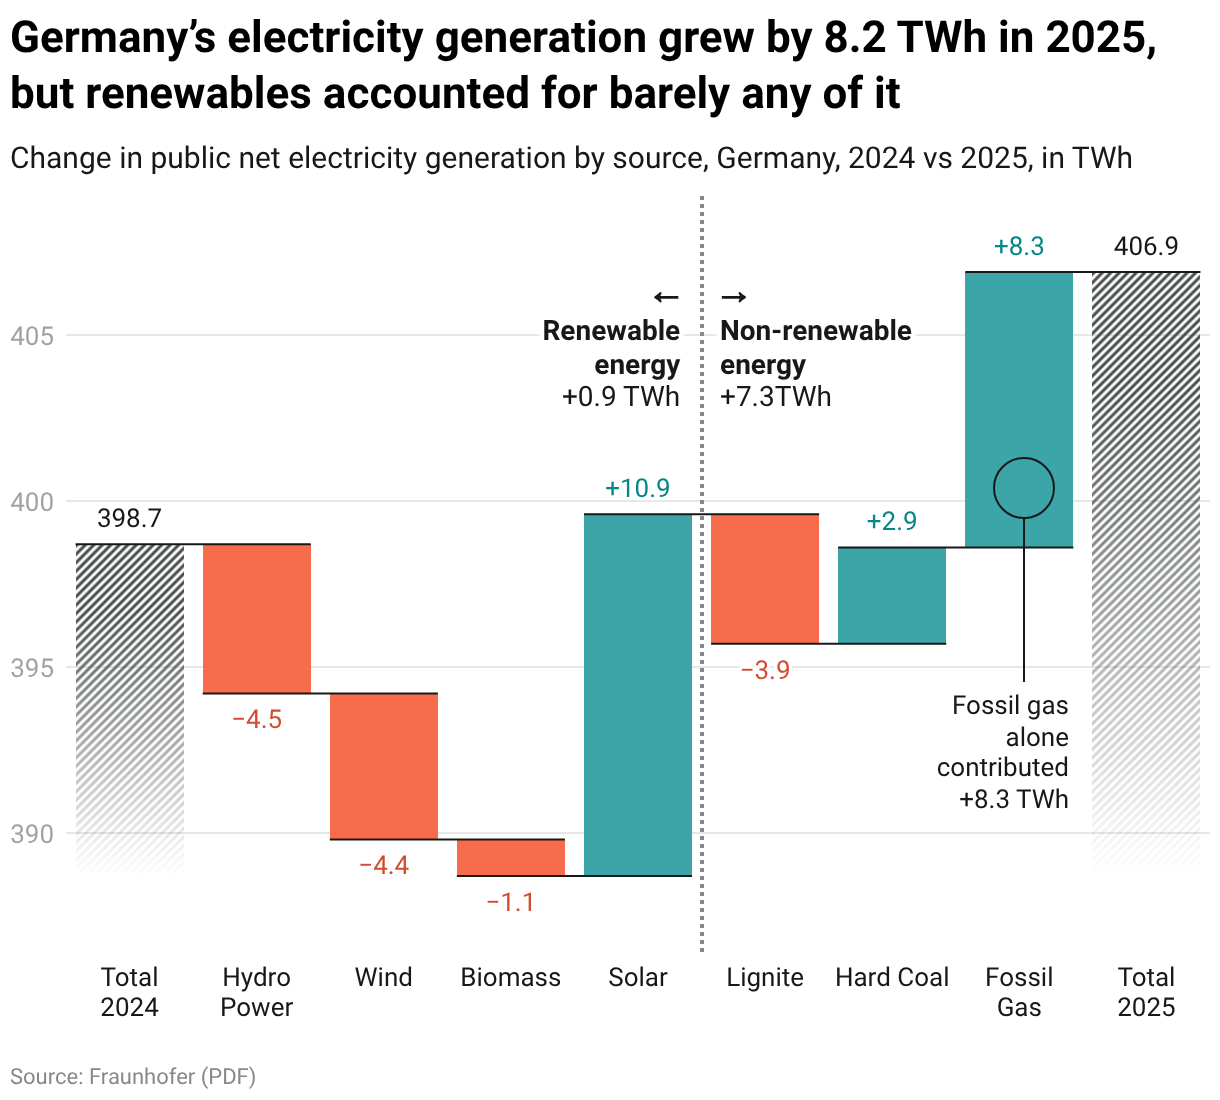
Waterfall charts 
Dual-axis chart
Compare the growth of measures on different scales
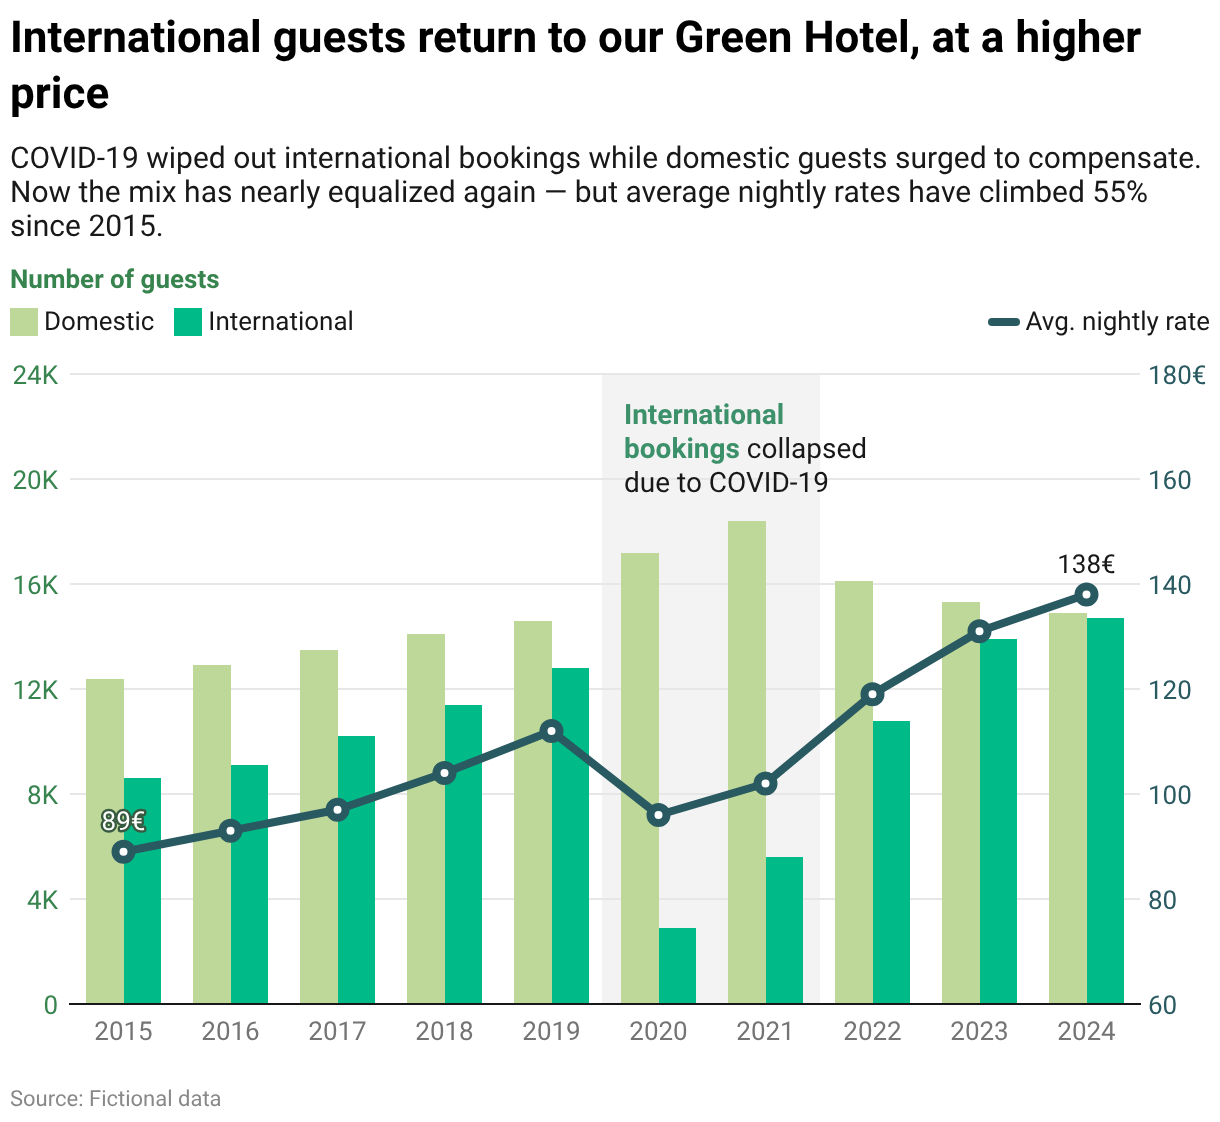
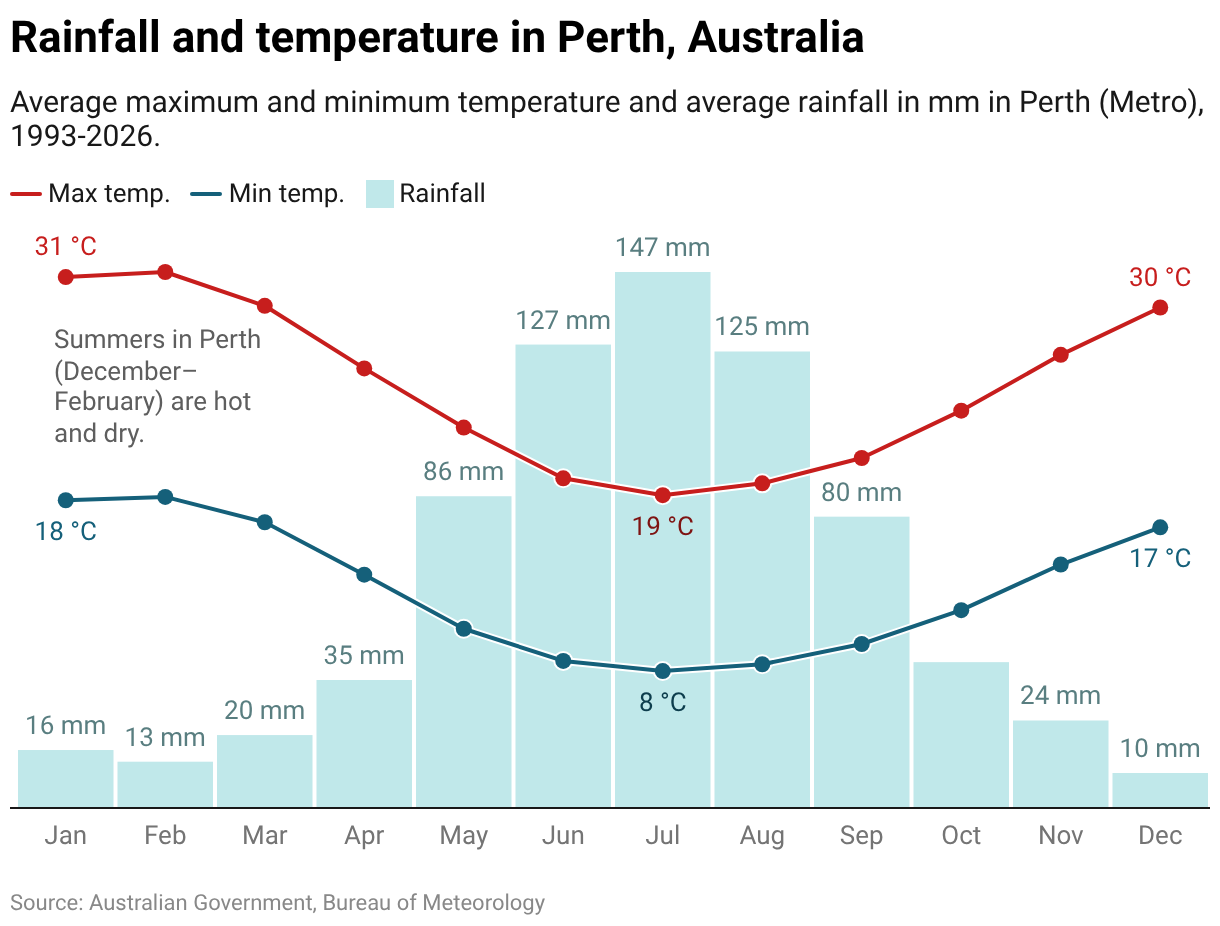
Dual-axis charts are perfect to answer the question: When one goes up, what does the other do? They make it easy to see when metrics rise and fall in sync — and when they don’t.
Compare different scales
You need to show customers in the thousands and revenue in the millions in the same view? When two measures in your data sit on very different scales, most charts flatten one of them. Dual-axis charts give each its own axis.
Built to be read correctly
Dual-axis charts are easy to misread. We put extra care into making sure yours aren’t. Colored grid labels, advanced legend layouts, aligned scales, data labels, and tooltips all help your audience read your chart the way you intended.
Waterfall chart
Show how parts add up to a total
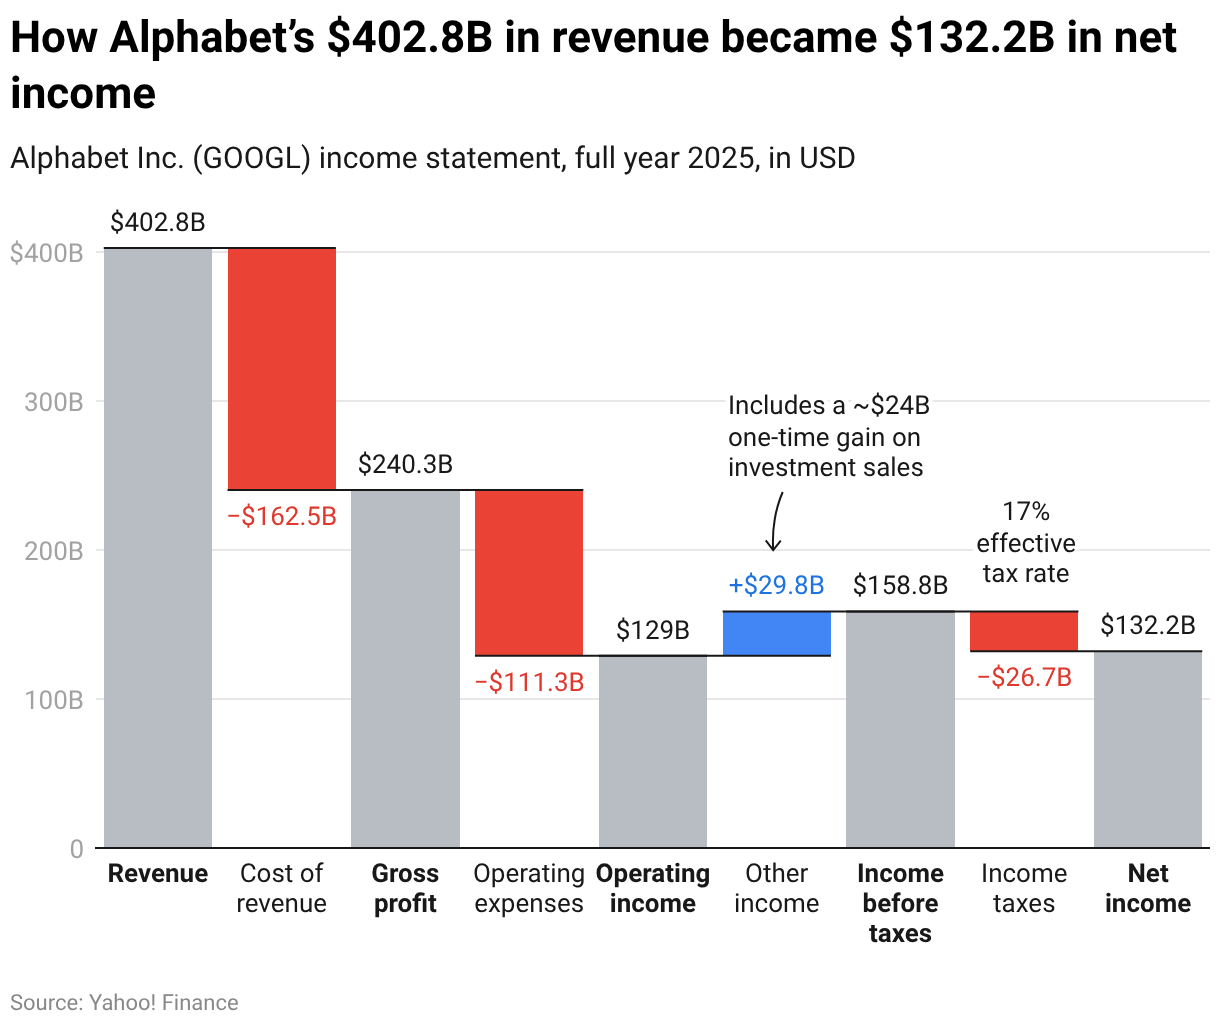
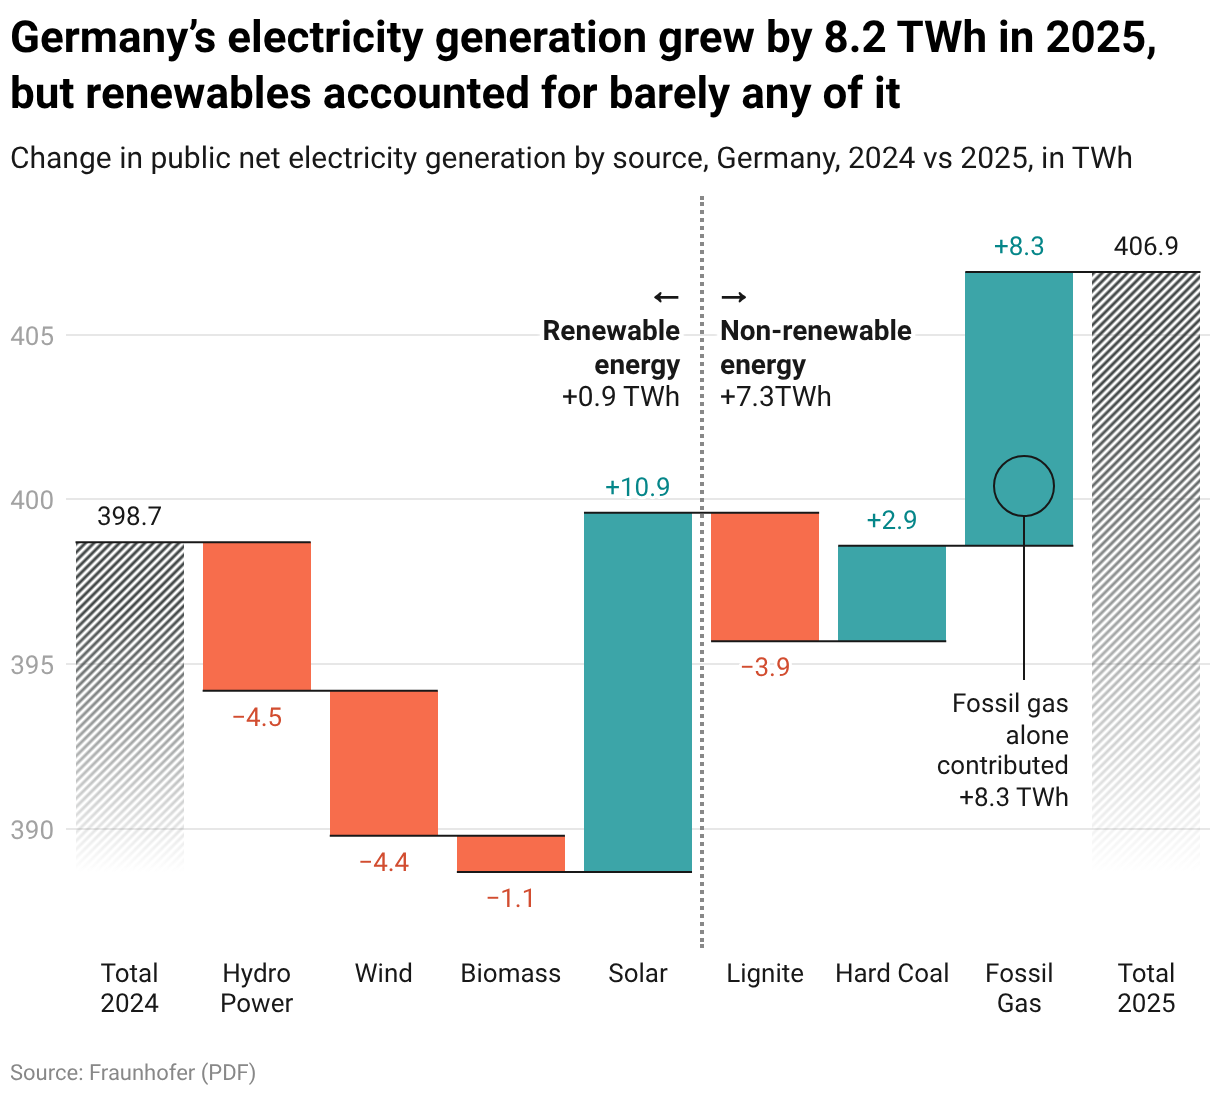
Waterfall charts are made for answering the question “How did we get here?” Use them to show change over time (like monthly revenue) or across categories (like the steps in an income statement).
Show what’s needed
Your data is unique, and your chart should be too. Decide on the style – colors, connecting lines, column width, and which values go where – and leave the math to Datawrapper. Totals, subtotals, and differences are calculated automatically.
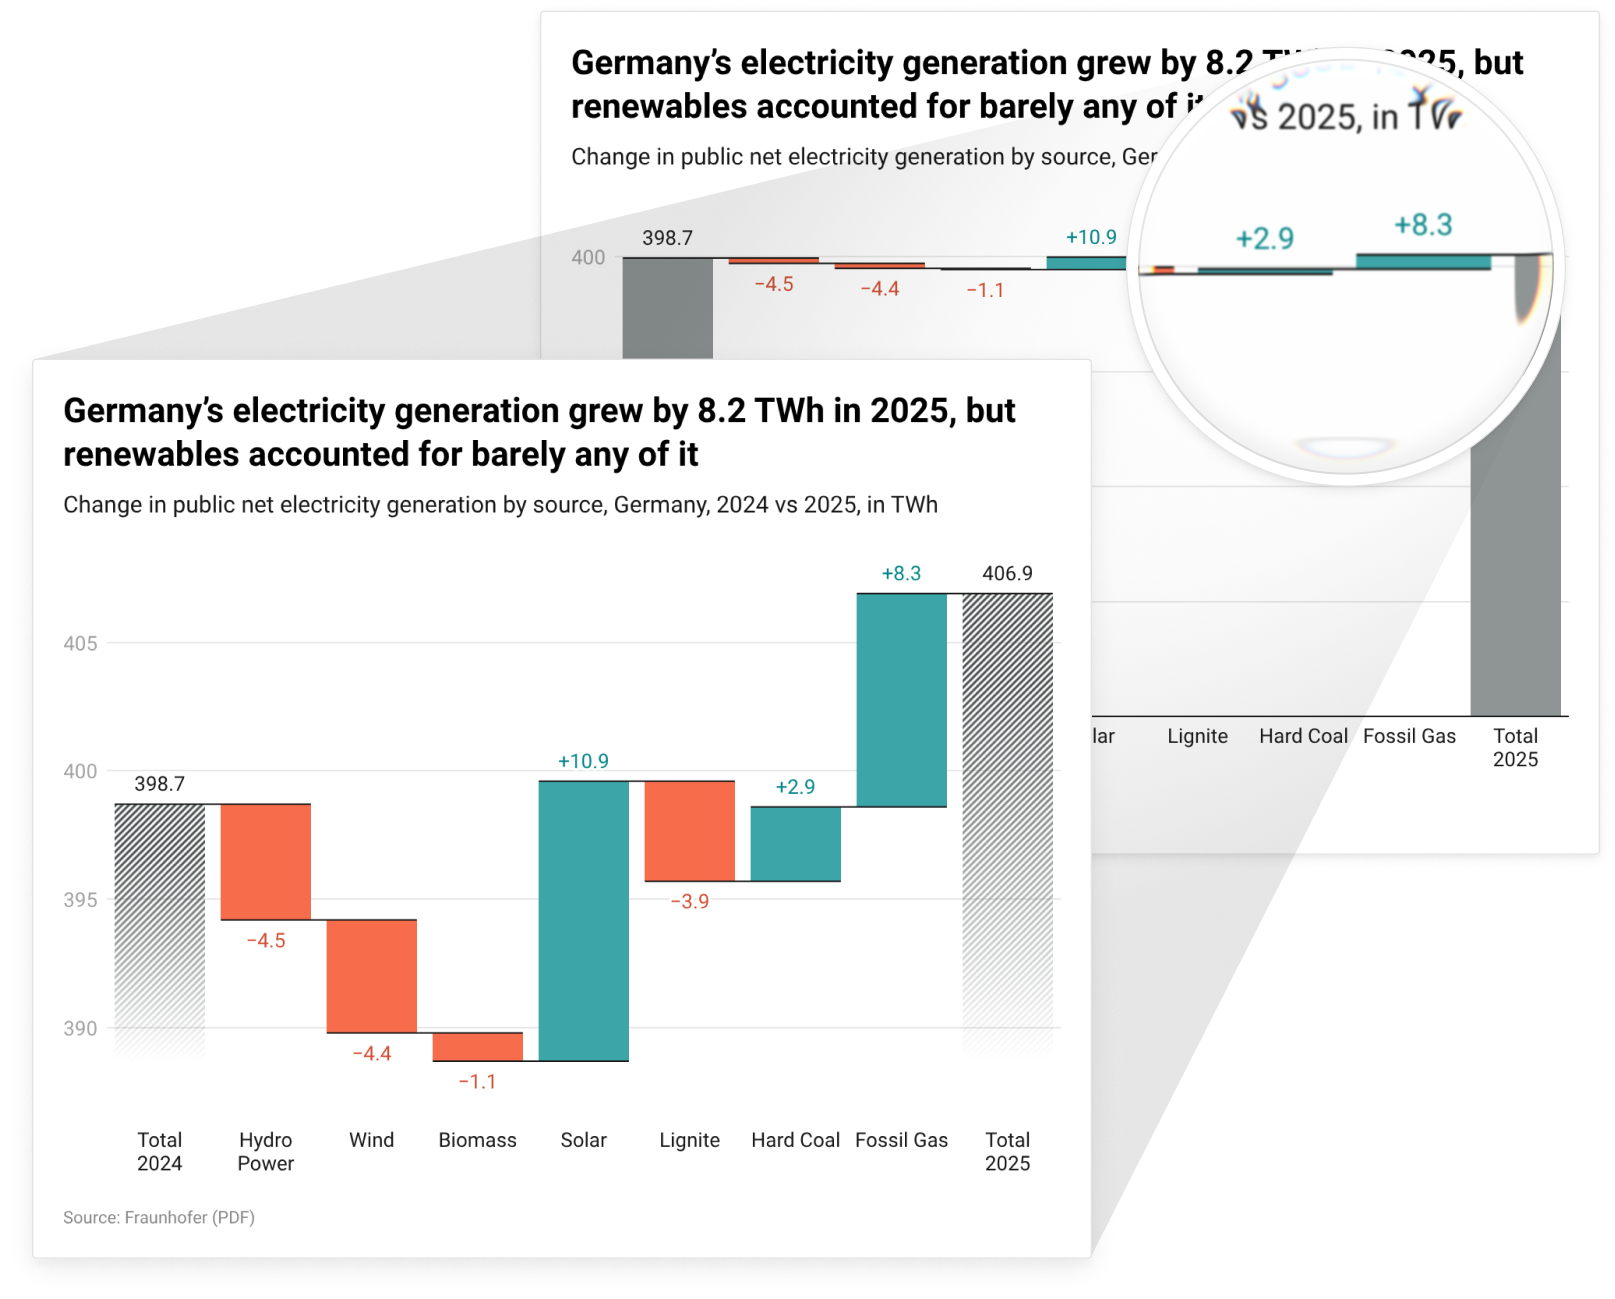
Zoom to differences
Focus on the parts that matter. When small changes are happening between large totals, our waterfall charts can zoom in on the differences.
Try it yourself
Jump right into the Datawrapper editor to explore what’s possible with our dual-axis and waterfall charts:


Upgrade to the Business plan to start visualizing your data with waterfall and dual-axis charts
Get access to every chart type in Datawrapper, plus much more:
Free
Yes, free
Includes these features:
- Create and embed interactive charts, maps, and tables
- Publish and embed visualizations on the web
- Download your visualizations as PNG images
Pro
$21 per user/month excl. VAT
All features of Free, plus:
- Remove attribution “Created with Datawrapper”
- Download your visualizations as PDF and SVG
- 90 day edit history for all changes
Business
$39 per user/month excl. VAT
All features of Pro, plus:
- Create waterfall and dual-axis charts
- Advanced & fine-grained team permissions
- 1 year edit history for all changes
Enterprise
Contact us
A fully custom solution:
- Custom agreements with uptime and support guarantees
- Self-hosting of published visualizations
- SAML Single-Sign-On