Product

Area chart

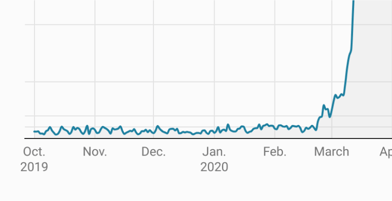
Example of a Datawrapper area chart
Create interactive, responsive area charts with Datawrapper – with beautiful annotations and tooltips.
Create an area chart

For trends where the sum matters as much as its parts

Our area charts are similar to our line charts, but with a few special features

Choose between a stacked and unstacked view.

Stacking your absolute values lets your readers see how the distribution of shares changes over time. Simply click on “Stack areas” and see your data in a fresh light.

A Datawrapper area chart with absolute values and the same area chart as stacked
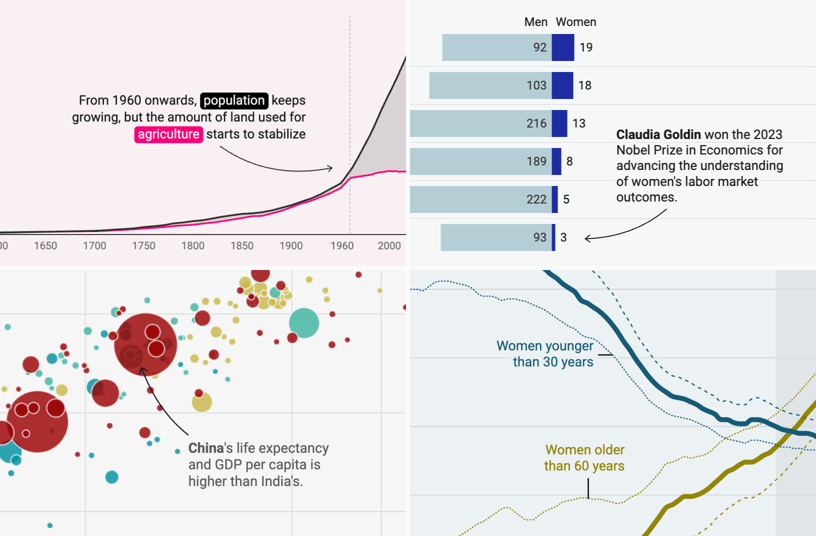
Show what happens and why with annotations.

Annotations are great to highlight data points or to add custom labels – and in Datawrapper, you can add them with one click.

Read about the annotations feature on our blog
Screenshot of the annotation feature for Datawrapper area charts
We get the details right. So you don’t need to worry about them.

Here’s a detail you might not have noticed: When you hover over the yellow areas, you’ll find that the color of the tooltip text is darker than the area itself. We increase the contrast to the background, to make sure your readers can decipher your tooltips.

That’s one of many little details we implemented to keep your charts readable, no matter your design choices.

Highlight areas
Use our vertical and horizontal range highlights to mark time ranges, e.g. to highlight projections.
Responsive
On desktop devices, tablets, or smartphones — Datawrapper visualizations are beautiful and readable everywhere.
Colorblind check
Benefit from our colorblindness simulator that automatically flags problematic colors. Learn more.
Show all Features

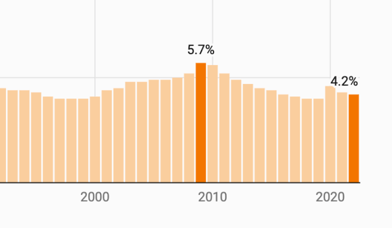
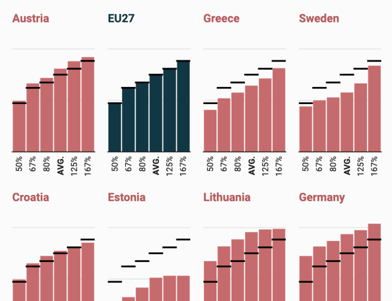
Examples of area charts

Get inspired, or re-use them for your own needs.

Need help creating Datawrapper charts?

We’re here for you.

Visit our Academy
Over 100 Academy articles explain how to create each chart type, step by step. Plus: how to upload data, embed charts, what to consider when creating tooltips, and more.
image
Contact Support
If you still have questions after consulting our Academy, do write us! Our customer happiness team will be back in touch as quickly as possible.
image

Try it for yourself, without signing up

No data? You can use our sample data.
Example of a Datawrapper area chart Create an area chart
Skip to content
We have updated our Privacy Policy to reflect the new EU regulations. It is written with the goal of clarity. Please give it a read and accept it.Accept