Product

Enrich your
stories with charts,
maps, and tables.

Start creating
It’s free & no sign-up is required

Charts

Use one of 20 interactive and responsive chart types ranging from simple bars and lines to arrow, range, and scatter plots.

Learn more about our charts
Maps

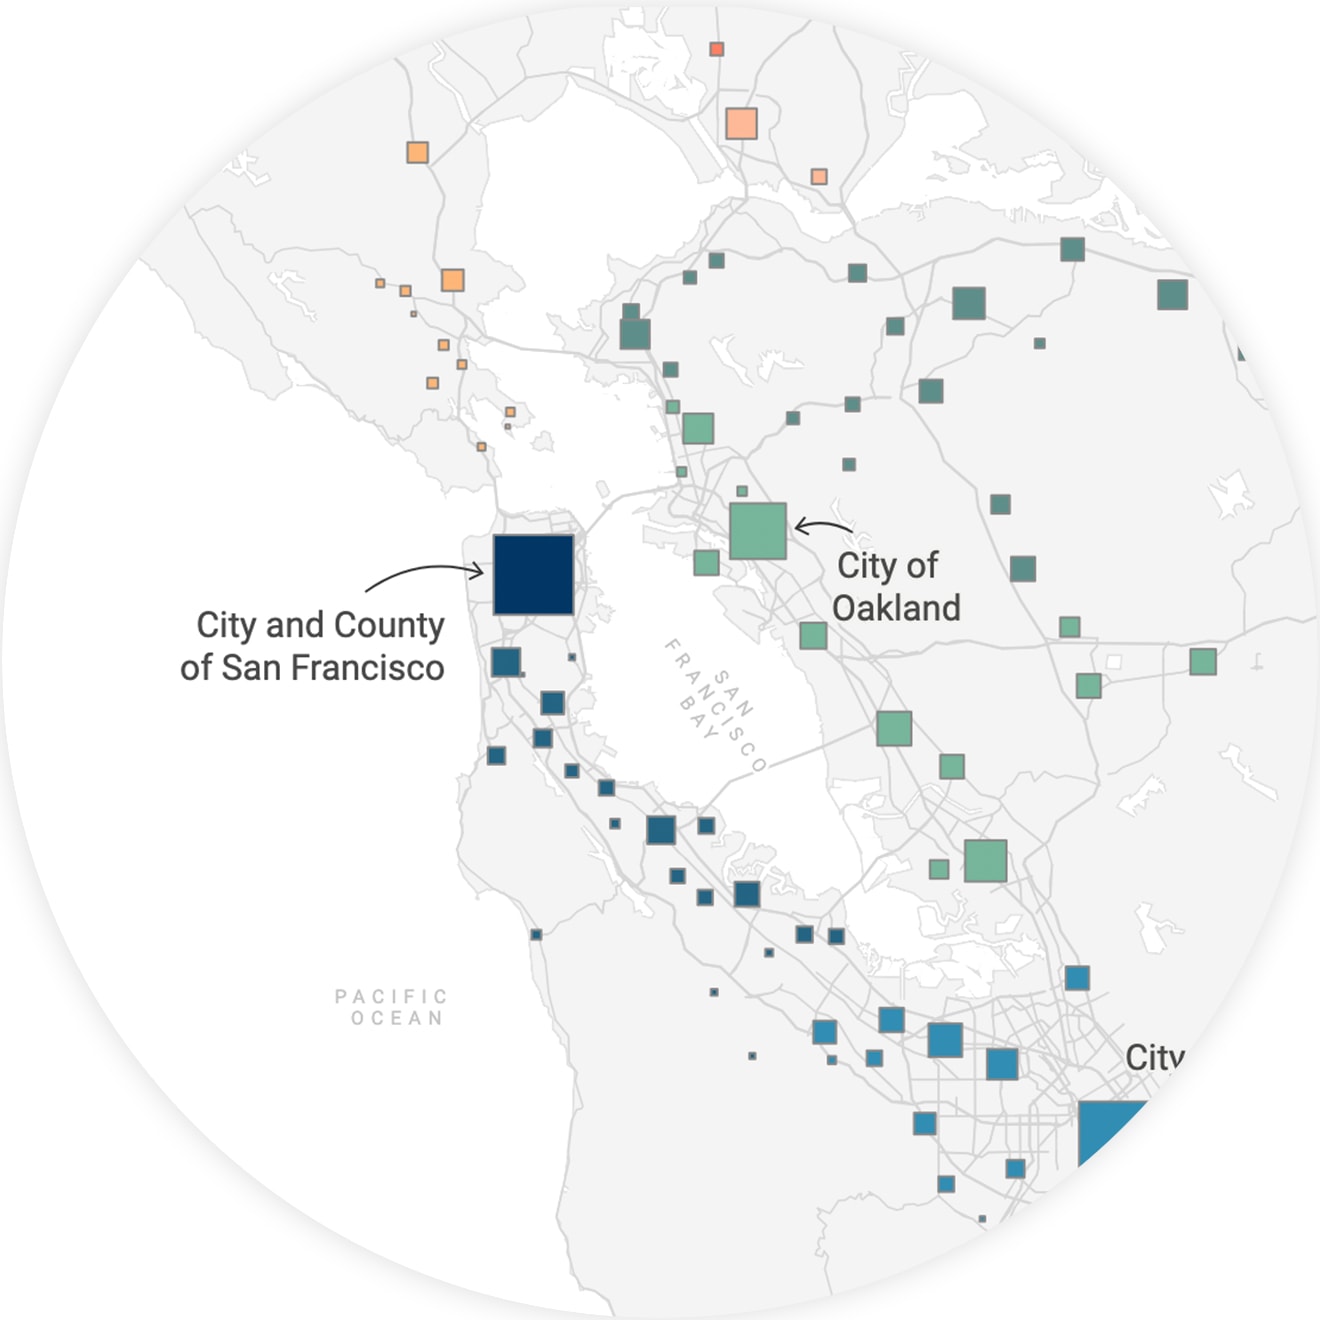
Three interactive and responsive map types let you create anything from locator maps to thematic choropleth and symbol maps.

Learn more about our maps
Tables

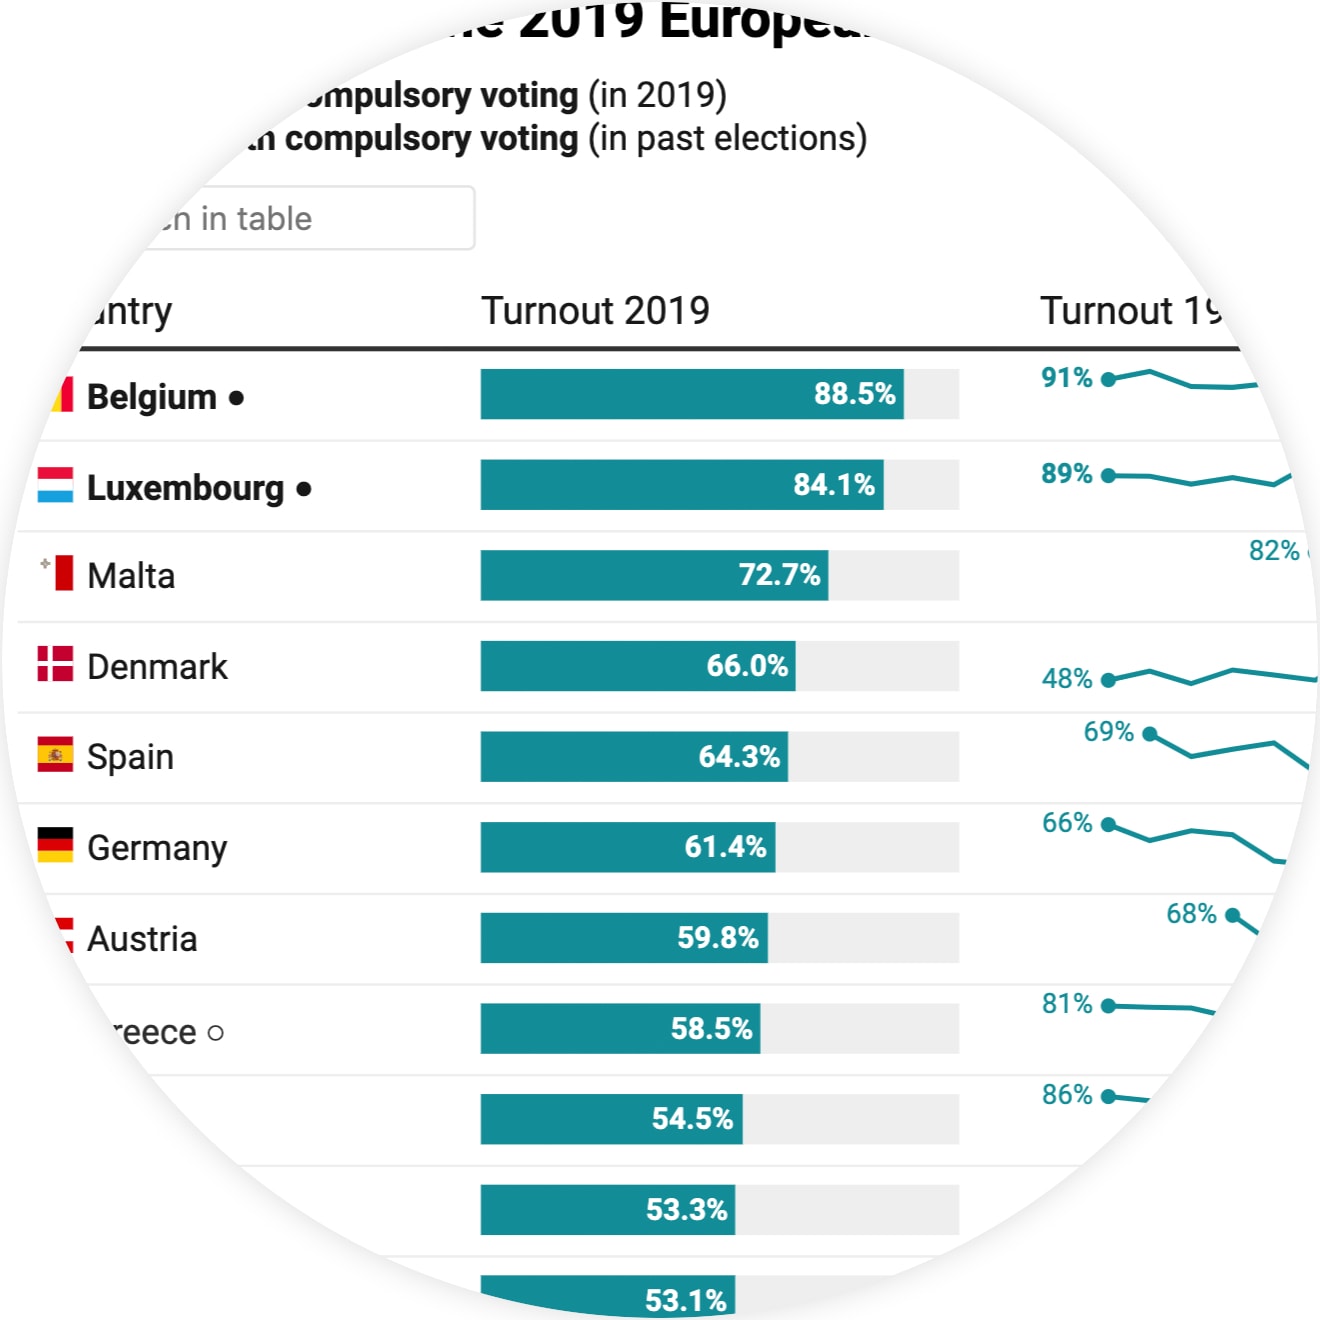
Responsive data tables allow for lots of styling options and let you include bar, column, and line charts, heatmaps, images, a search bar, and pagination.

Learn more about our tables

Serving charts and maps for millions of readers
every day.

Datawrapper helps some of the world’s best teams to tell their stories with data.

Customer Logos Customer Logos

No code or design skills required.

Our goal is to enable everyone to create beautiful charts, maps, and tables. Including you.

1
Copy & paste your data

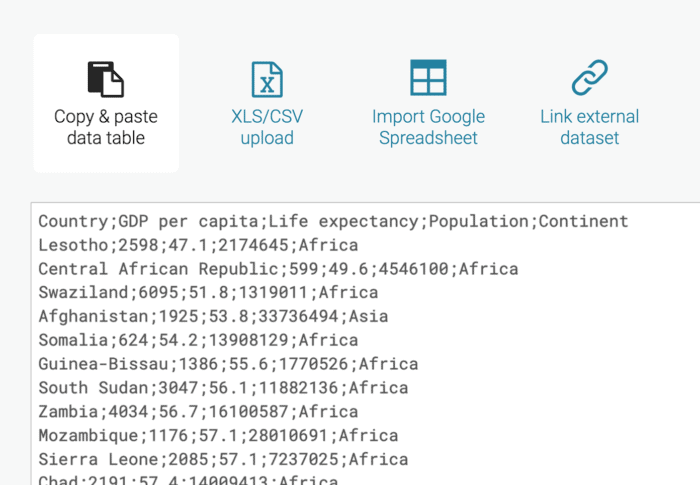
Copy your data from the web, Excel, or Google Sheets. You can also upload CSV/XLS files or link to a URL or Google Sheet for live-updating charts.

Datawrapper Upload Data interface
2
Edit your chart

Choose from many chart and map types with one click. Then customize and annotate your chart to make it more effective.

3
Embed or download

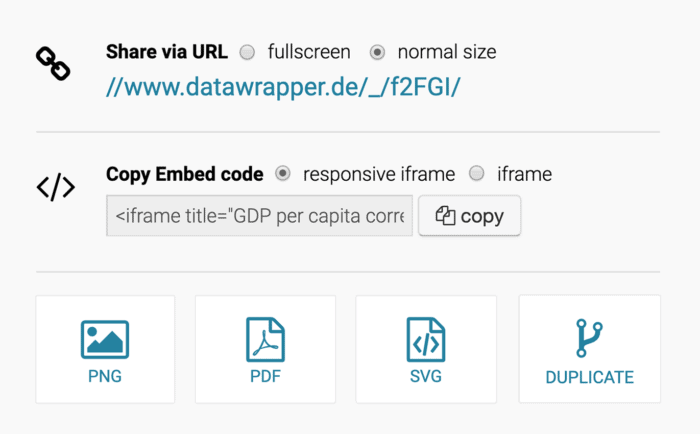
Copy the responsive embed code into your CMS or website to show the interactive chart, or export as a PNG, SVG, or PDF for printing.

Datawrapper Sharing, Embedding and Exporting options

All the features you need to create visualizations for your articles, reports, or publications.

Missing something? Special wishes? Tell us at hello@datawrapper.de.

Unlimited visualizations
Even with the free plan, there’s no limit to the number of charts, maps, and tables you can create.
Private by default
No matter which plan you choose, all your visualizations and data are private until you hit the “Publish” button.
Responsive
On desktop devices, tablets, or smartphones — Datawrapper visualizations are beautiful and readable everywhere.
Collaborate in teams
Make use of shared folders, Slack and Teams integration, and admin permissions to see what your team is creating. Learn more.
Comes in your design
Send us your style guide and we’ll create a custom design theme for your brand, 100% white-labeled. Learn more.
PNG, SVG, PDF export
Export every visualization as PNG, SVG, or PDF and continue working with tools like Adobe Illustrator.
Live updating
Create visualizations that update themselves periodically. Simply link to an external CSV or Google Sheet. Learn more.
Dark mode
All visualizations work seamlessly in both light and dark mode, adapting to your readers’ preferences. Learn more.
Print export
Export print-ready PDFs with custom layouts, pre-defined CMYK colors, and pre-defined sizes. Learn more.
Show all Features

“Ridiculously easy,” “a quantum leap forward,” “keeps blowing my mind” — we’re happy when our users are happy.

Datawrapper is my favorite tool to make charts that work across platforms — it’s quick, clean, and elegant.
picture of Rani Molla
Rani Molla
Senior Data Reporter at Recode
Datawrapper minimises the need to use alternative, time-consuming visualization methods. It has also enabled the wider team to embellish stories with data graphics — without assistance or additional training.
picture of Adam Smith
Adam Smith
Data Editor at Sky Sports

Do you have questions? Let’s talk!

Contact us here so we can help
image Contact Sales
Skip to content
We have updated our Privacy Policy to reflect the new EU regulations. It is written with the goal of clarity. Please give it a read and accept it.Accept