Product

Create responsive tables with Datawrapper

Build your own table
It’s free & no sign-up is required.

Let readers explore your data in a beautiful way.

Datawrapper’s flexible tables come with lots of styling options.

Bring tiny column and line charts into your tables

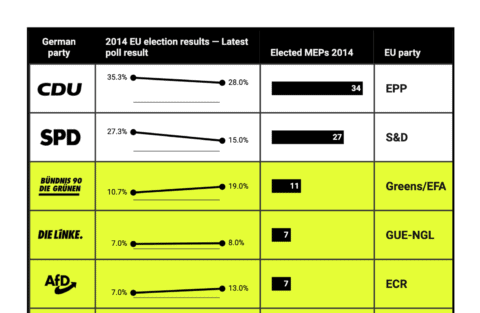
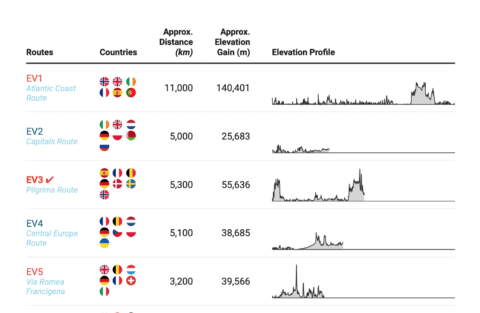
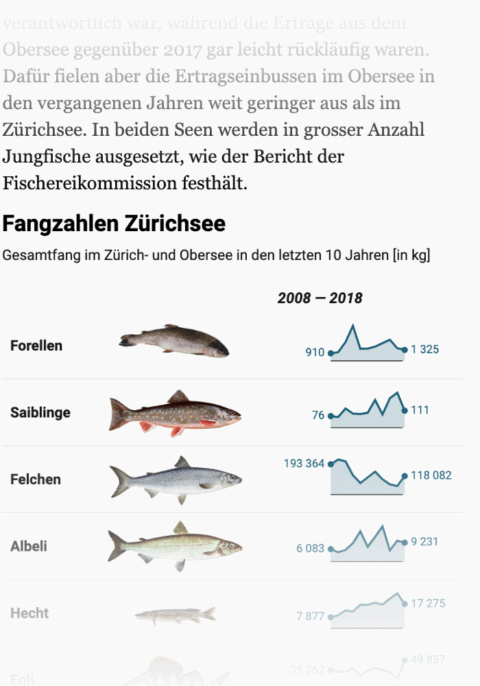
In our tables, you can select several number columns and turn them into tiny column charts or line charts called “sparklines”.

They’re great to bring nuance into your table: Instead of just displaying the values of the first date and last date (e.g. 1960 and 2016), sparklines and column charts show how a variable developed over time.

Customize Datawrapper tables to your needs.

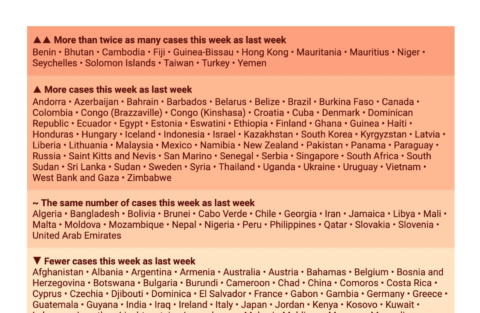
Highlight the most important rows or tone down columns that add only background information.

Change the font style, color, background color, column width, add border lines or images – or select multiple columns and style them all at once.

Make values jump out visually with heatmaps

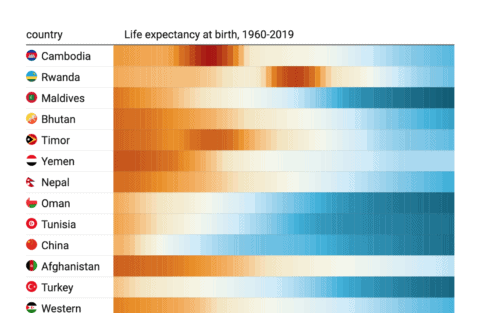
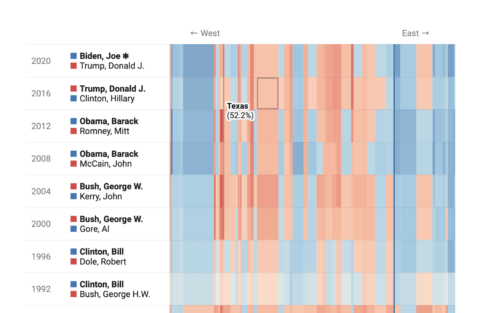
Use Datawrapper’s heatmaps to transform your numbers into a visualization that enables your readers to quickly see patterns and outliers in your table.

Read more about heatmaps on our blog
GIF of how to make heatmaps in Datawrapper tables
Let your readers search and sort tables.

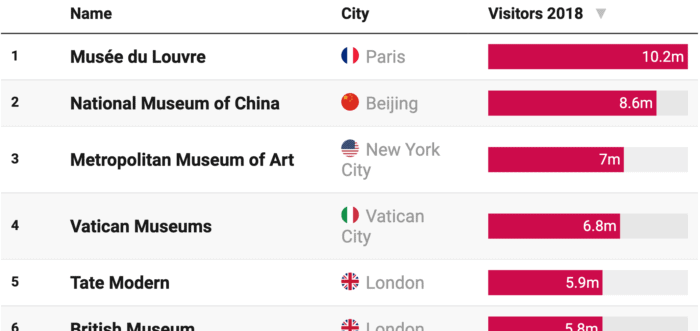
You might create tables to let readers look up information that is most relevant for them – about the city they live in, the party they voted for, or the income they have.

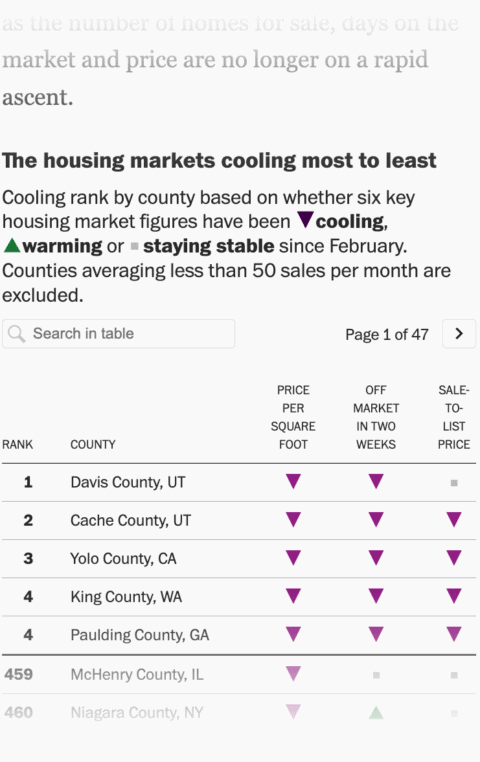
Our tables offer custom column sorting, search and pagination to help your readers achieve that goal. Try searching for “London”, “Paris” or “Tokyo” in the table on the right.

More than static tables: responsive, customizable and live-updating.

Here’s what will make your life easier.

Unlimited visualizations
Even with the free plan, there’s no limit to the number of charts, maps, and tables you can create.
Private by default
No matter which plan you choose, all your visualizations and data are private until you hit the “Publish” button.
Responsive
On desktop devices, tablets, or smartphones — Datawrapper visualizations are beautiful and readable everywhere.
Collaborate in teams
Make use of shared folders, Slack and Teams integration, and admin permissions to see what your team is creating. Learn more.
Automate chart creation
Create, update, and export visualizations without a single click, using our state-of-the-art API. Learn more.
Works for big audiences
Datawrapper visualizations scale to the largest audiences and support even millions of viewers.
Comes in your design
Send us your style guide and we’ll create a custom design theme for your brand, 100% white-labeled. Learn more.
PNG, SVG, PDF export
Export every visualization as PNG, SVG, or PDF and continue working with tools like Adobe Illustrator.
Print export
Export print-ready PDFs with custom layouts, pre-defined CMYK colors, and pre-defined sizes. Learn more.
Show all Features

You’re in good company.

Leading publications like SPIEGEL and The Washington Post build tables with Datawrapper.

Zürichsee Zeitung

The Swiss local newspaper Zürichsee Zeitung used our tables with images and sparklines to show that more fish is caught in 2018 than in 2017.

Visit the story on zsz.ch
The Washington Post

The Washington Post uses Datawrapper tables to compare six housing market metrics in 458 U.S. counties.

Visit the story on washingtonpost.com
New America

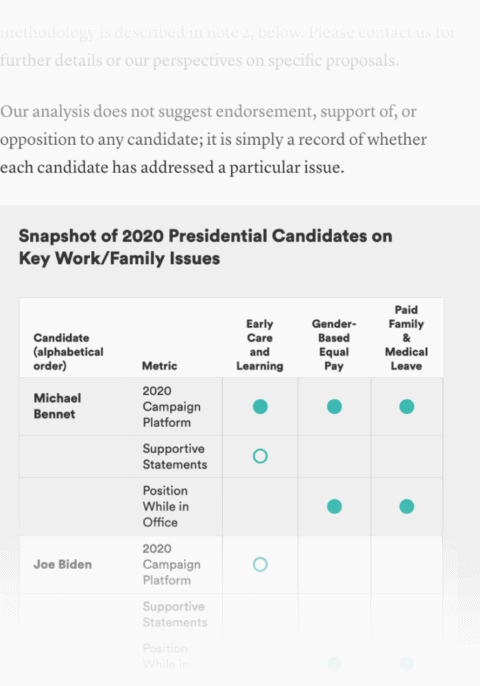
Public policy think tank New America explained how the 2020 presidential candidates stand on selected work/family issues.

Visit the story on newamerica.org

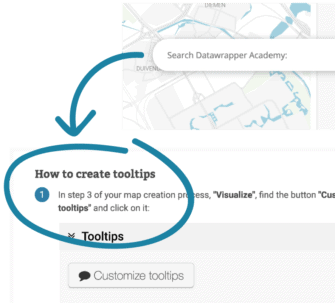
Need help creating Datawrapper tables?

We’re here for you.

Visit our Academy
Over 100 Academy articles explain how to create tables, step by step. We also teach some pro tips, like how to create live-updating tables.
image
Contact Support
If you still have questions after consulting our Academy, do write us! Our customer happiness team will be back in touch as quickly as possible.
image

Try it for yourself, without signing up

No data? You can use our sample data.
example of a Datawrapper table Create a table
Skip to content
We have updated our Privacy Policy to reflect the new EU regulations. It is written with the goal of clarity. Please give it a read and accept it.Accept